 By:
By:
Glencore (LON: GLEN) share price has pulled back sharply in the past few days as concerns of a global recession continued. The stock slipped to a low of 448p, which was the lowest level since September 2nd of this year. It has dropped by more than 10% this month meaning that it has moved to a correction zone.
China challenges emerge
Glencore is a leading global mining company that provides some of the most useful commodities. It is a major provider of coal, which has become crucial as natural gas prices rally. The firm also mines important commodities like copper and nickel.
Glencore is also a leading player in the trading industry. It is one of the biggest oil traders in the world, where it competes with companies like Shell, Vitol, Trafigura, and Gunvor among others.
The company’s business tends to do well in a period when the global economy is booming. In particular, the firm excels when the Chinese economy is doing well. Unfortunately, the opposite is happening.
According to the OECD, China’s economy will experience a much slower economic growth this year. Another report by the World Bank estimated that the country’s economy will grow by 2.3% this year and underperform the rest of Asia.
Glencore has another China-related concern to worry about. The firm is expected to suffer as Maike Metals, its largest partner in the country goes through a cash crunch. The firm was selling about 600k tonnes a year of high purity copper into China through the company.
Maike Metals, which is one of the largest commodity traders in China, is facing financing challenges and there are chances that it will move out of business. It has billions of dollars in debt and has struggled to raise additional capital.
Glencore share price forecast
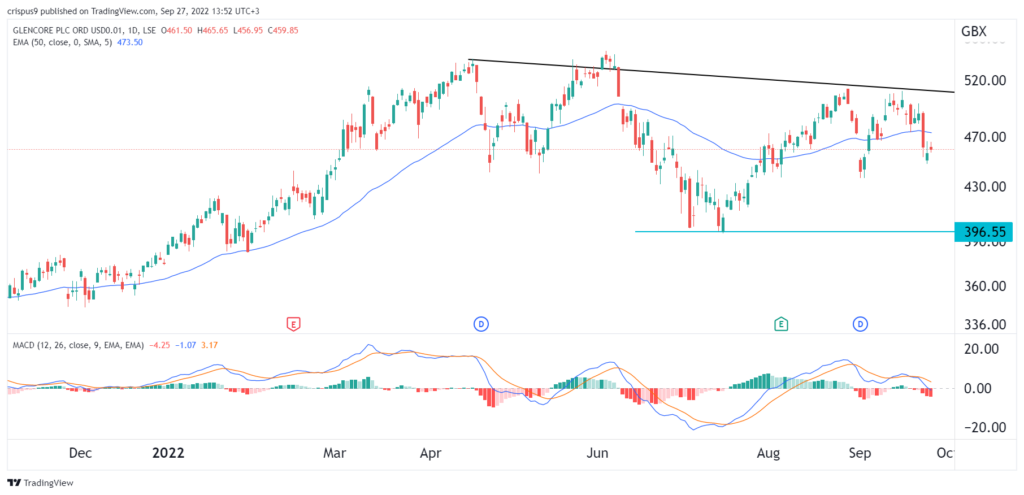
As I wrote in this article, Glencore share price formed a dangerous triple-top pattern. In most cases, this pattern usually leads to a bearish breakout. At the same time, the stock has moved below the 25-day and 50-day moving averages while the MACD has formed a bearish divergence pattern.
Therefore, there is a likelihood that the stock will have a bearish breakout as the company’s business slows. If this happens, it will likely move below the support at 400p.
Still, a closer look shows that the stock has formed what looks like an inverted head and shoulders pattern, which is usually a bullish sign. This pattern will be invalidated if it moves below the right shoulder at 435p.