Key Takeaways
- Descending triangles are a common bearish technical chart pattern in financial markets.
- Identification involves looking for a downtrend, drawing horizontal and descending trendlines, and confirming the pattern.
- Analysis includes considering the trend direction, support and resistance levels, volume, duration, breakout direction, and false breakouts.
- Technical analysis tools can be used to identify trends and potential support/resistance levels.
- Descending triangle patterns can also be bullish or bearish depending on the breakout direction.
- Risk management is important to successfully trading this type of pattern – stop-and-take profit levels should be set correctly to minimize potential losses while maximizing returns.
A descending triangle pattern is a bearish technical chart pattern that can occur in financial markets such as stocks, forex, and commodities. It is formed when the price of an asset forms lower highs, indicating a downward trend, while the lows remain at a similar level, creating a horizontal support line. Traders use this pattern to predict potential price movements and develop trading strategies.
The descending triangle pattern suggests that sellers are more aggressive than buyers, and a breakdown below the horizontal support level is considered a bearish signal. In this article, we will discuss how to trade the descending triangle pattern and the key considerations traders should keep in mind.
Introduction to Descending Triangle Pattern
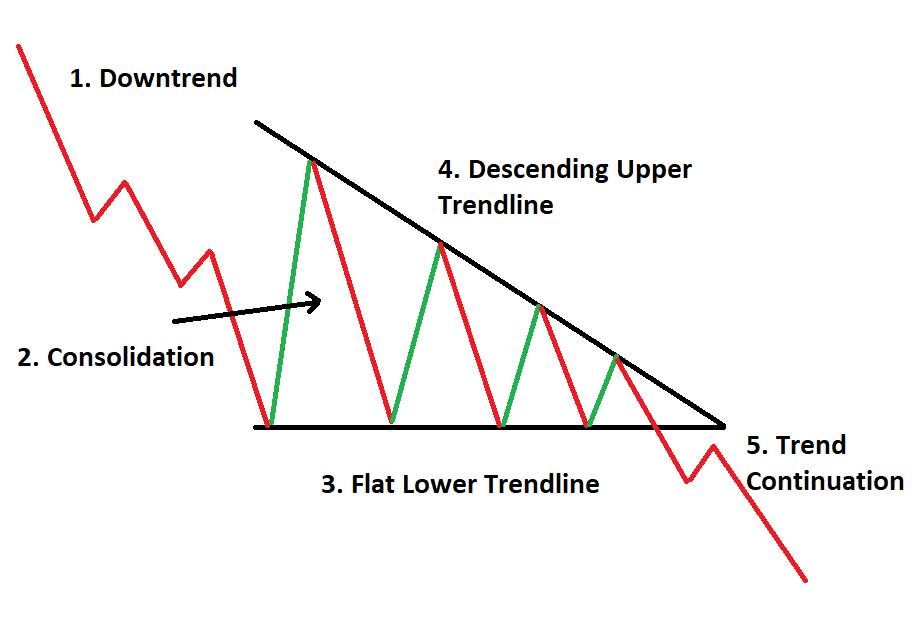
Descending triangle pattern is a common chart pattern used in technical analysis to identify potential price trends. It is formed by drawing a horizontal trend line at a support level and connecting a series of lower highs with a descending trendline. The descending triangle pattern is considered a bearish pattern and indicates a potential price decline in the asset.
The pattern is formed during a downtrend when sellers are in control of the market. The lower highs formed by the price action indicate that the sellers are gradually gaining control and the buyers are losing strength. The support level, which is formed by connecting a series of lows, indicates a price point where buyers may enter the market.
Once the support level is broken, it can lead to a significant price decline, and traders may look for opportunities to enter short positions. However, false breakouts can occur, and traders should be cautious and wait for confirmation before entering a trade.
How to Identify Descending Triangle Pattern
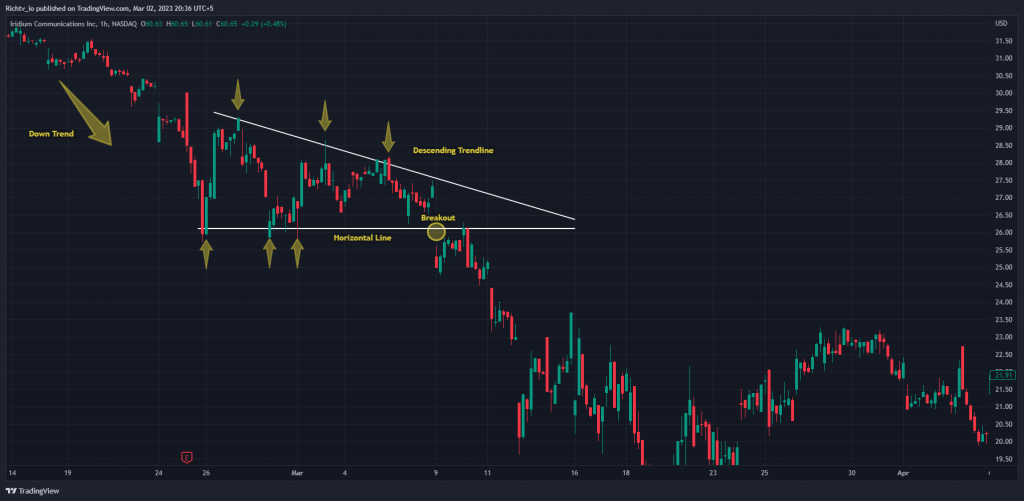
Identifying a descending triangle pattern can be easy if you know what to look for. The continuation pattern is characterized by a lower horizontal support level with a series of lower highs as the pattern completes its descending upper trend line. When this is seen on price charts, it suggests reduced buying pressure and an eventual break through the bottom of the triangle. Generally, traders use this information to make educated decisions when deciding on an entry or exit point in the market.
Here are the steps to identify a descending triangle pattern:
Look for a downtrend: A descending triangle pattern forms during a downtrend, so the first step is to look for a series of lower highs and lower lows in the asset’s price chart.
Draw a horizontal line: Identify a support level where the price has previously bounced off multiple times. Draw a horizontal line at this level to connect the lows.
Draw a descending trendline: Connect the series of lower highs using a descending trendline. The trendline should be drawn above the price action and run parallel to the horizontal support line.
Confirm the pattern: The pattern is confirmed when the price approaches the support level and bounces off the descending trendline at least two times. The more times the price touches the trendline, the stronger the pattern becomes.
Look for a breakout: A breakout occurs when the price breaks below the support level. This is a bearish signal and can indicate a potential price decline.
Analyzing the Descending Triangle Chart Patterns
When it comes to price prediction, technical traders may scrutinize price behavior patterns. One price breaks continuation pattern is the descending triangle. Characterized by a flat lower support trend line that meets a downward-sloping upper trend line resistance, buyers are thought to put strong pressure on prices which causes prices to accumulate at the resistance level and eventually break out of the pattern and resume their price trajectory.
Here are some key factors to consider:
Trend direction: The descending triangle pattern is formed during a downtrend, indicating that sellers are in control of the market. This is confirmed by the lower highs formed by the price action.
Support level: The lower trendline acts as a support level, indicating a price point where buyers may enter the market. If the support level is broken, it can lead to a significant price decline.
Resistance level: The upper trendline acts as a resistance level, indicating a price point where sellers may enter the market. If the resistance level holds, it can lead to a consolidation period.
Volume: Volume analysis can help confirm the strength of the pattern. If the volume is high during the formation of the pattern, it can indicate that sellers are more aggressive.
Duration: The duration of the pattern can vary. Generally, the longer the pattern takes to form, the more reliable it is.
Breakout direction: The breakout direction is a crucial factor in determining the potential trading strategy. A breakdown below the support level is considered a bearish signal, while a breakout above the resistance line is considered a bullish signal.
False breakouts: False breakouts can occur when the price briefly breaks out of the pattern but then quickly retraces. Traders should be cautious of false breakouts and wait for confirmation before entering a trade.
Descending Triangle Pattern Price Projection
The bearish chart pattern known as the descending triangle indicates a potential price projection downwards and typically marks bearish market sentiment. The lower trend line shows support while the upper trend line is descending resistance, usually to a point at which it eventually breaks the support line until the triangle is complete.
Here’s how it works:
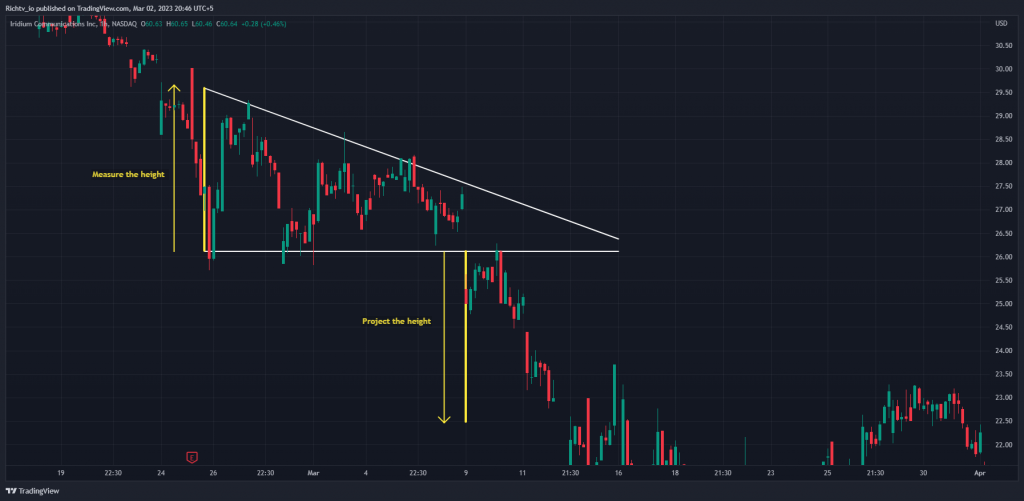
Measure the height of the pattern: To measure the height of the pattern, find the highest point of the upper trendline and measure the distance to the support line directly below it.
Project the height: Once the height of the pattern is measured, project it downward from the breakout point. The breakout point is where the price closes below the support line.
Calculate the price target: The projected height of the pattern can be used to estimate a potential price target for the asset. This is done by subtracting the pattern’s height from the breakout point.
For example, let’s say a stock is in a descending triangle pattern with a height of $10. If the stock breaks below the support level at $50, the projected price target would be $40 ($50 – $10).
How to Trade the Descending Triangle Chart Pattern
Trading the descending triangles is an important technical analysis strategy that can help maximize profits while minimizing risk. To trade this continuation pattern, look for a contracting range in price and a downward-sloping trend line as confirmation. When you spot a breakout towards the downside, watch for confirming signals like a high-volume sell-off that will indicate a continuation of the lower trend.
If your analysis is correct, shorting at or near that support level can yield large profits over time with limited risk and tight stop losses to preserve capital. With patience and calm discipline, trading the descending triangle pattern can be a rewarding investment decision.
Here are some steps to consider when trading the pattern:
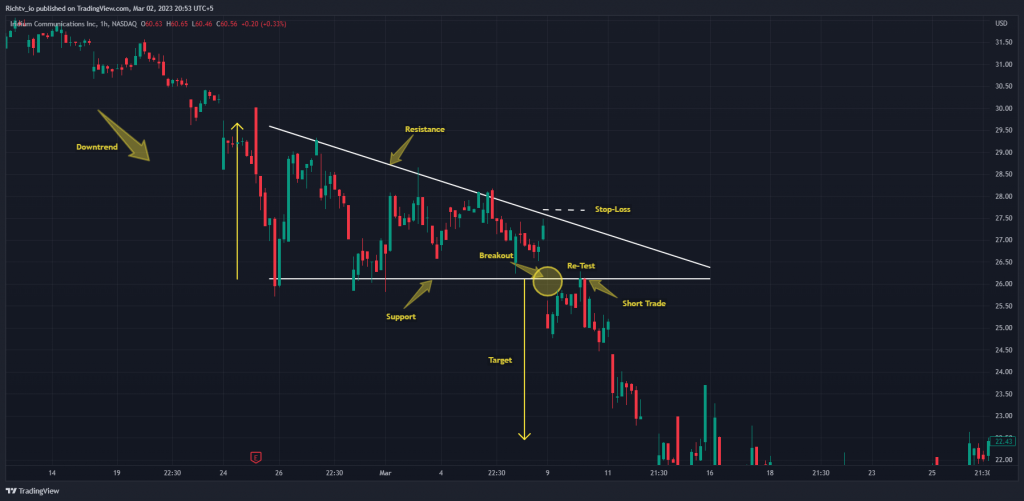
Identify the pattern: First, identify the descending triangle pattern by drawing trendlines that connect the lower highs and lows of the asset’s price action.
Wait for a breakout: Wait for the price to break below the support level of the descending triangle pattern. This is a bearish signal and could indicate further price declines.
Place a short trade: Once the price breaks below the support level, enter a short position. This involves selling the asset, expecting the price to continue to decline.
Set a stop-loss: Set a stop-loss order above the upper trendline to protect against potential losses if the price reverses and breaks out of the pattern.
Set a profit target: To set a profit target, measure the height of the pattern and subtract it from the breakout point. This can give an estimate of the potential price decline. Set a take-profit order at the calculated level.
Using Technical Analysis with Descending Triangle Pattern
Technical analysis, when used with descending triangle chart patterns, can be an effective way to predict trends in the stock market. A descending triangle is created when a stock or asset’s price continues downward momentum and is met with regularly recurring support levels on the chart.
Here are some technical analysis tools that can be used:
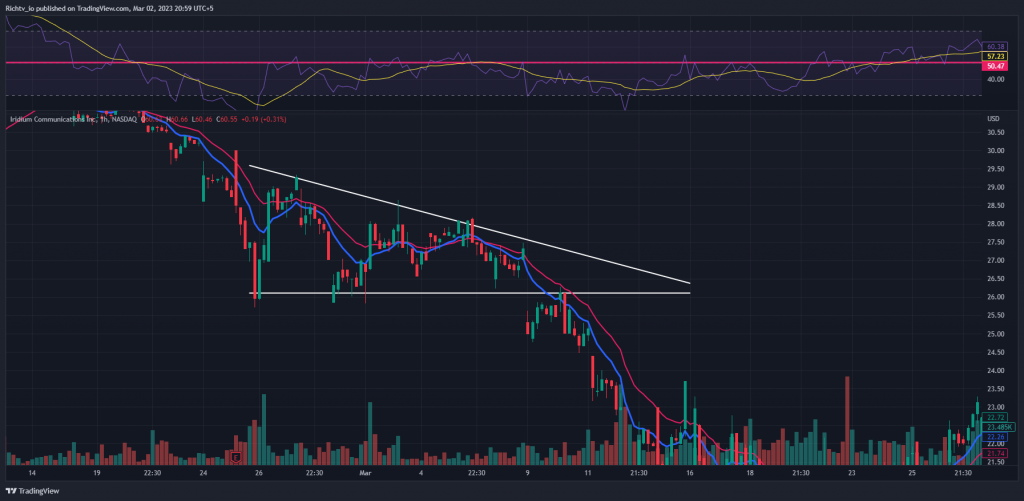
Volume: Volume can be used to confirm the validity of the pattern. A breakout below the support level with high volume is more likely to indicate a true price decline.
Moving averages: Moving averages can be used to identify trends and potential support and resistance levels. The 50-day and 200-day moving averages are commonly used.
Oscillators: Oscillators, such as the relative strength index (RSI) and the stochastic oscillator, can be used to identify overbought and oversold conditions. A bearish divergence in the RSI or stochastic oscillator can confirm a potential price decline.
Fibonacci retracements: Fibonacci retracements can be used to identify potential support levels. The retracements are drawn from the high to the low of the pattern, and the 50% and 61.8% retracement levels are commonly used.
Price targets: Price targets can be estimated by measuring the height of the pattern and subtracting it from the breakout point. This can give an estimate of the potential price decline.
Bullish and Bearish Descending Triangle Reversal Pattern
A descending triangle reversal pattern is a useful technical analysis indication of potential price movements in stocks. By plotting the high and low points over a set period, descending triangles form a recognizable shape. These patterns usually occur during downtrends, but can be both bullish or bearish depending on their Breakout direction.
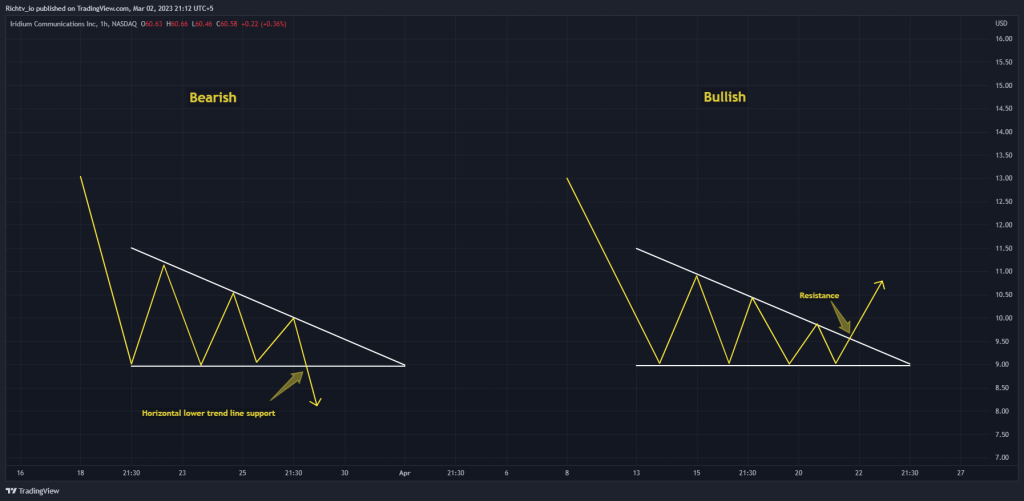
When descending triangles break out above resistance they are considered bullish while a breach of the horizontal lower trend line support may be seen as a sign of a bearish descending triangle. Knowing how to detect descending triangle patterns early on could provide investors with great insight into the likely future direction of their investments.
Risk Management for Descending Triangle Pattern Trades
Risk management is an essential component of any successful trading strategy, and this is especially true for descending triangle pattern trades. Using a risk-adjusted approach when trading this type of technical pattern, can help minimize the potential losses while still allowing a trader to reap the benefits of these low-risk trading strategies.

The key to effective risk management with a descending triangle pattern trade is to ensure that the stop-and-take profit levels are set correctly. The stop should be set at or just below the breakout point of the triangle and the take profit level should be placed at or just below the low made after the breakout from the triangle has occurred. By utilizing this risk-management strategy traders can generate consistent returns cost-effectively.
Descending Triangle Pattern vs Symmetrical Triangle
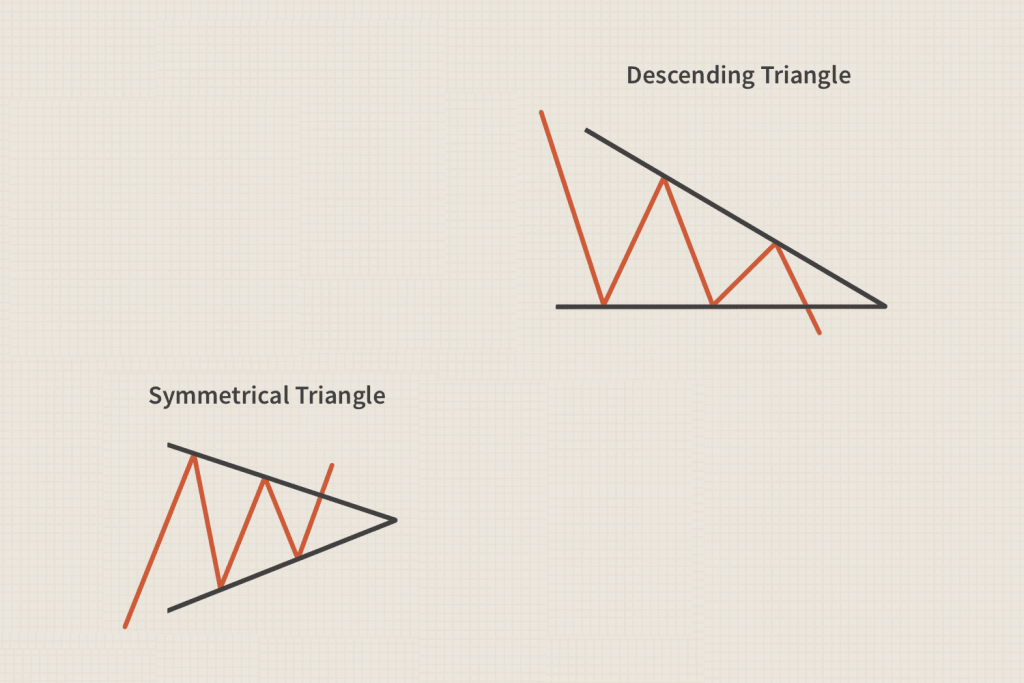
The two continuation patterns are two of the most popular technical analysis tools used in markets. The Descending Triangle Pattern is a bearish continuation pattern that signals when a price is likely to make a downward move, whereas the Symmetrical Triangle is a two-trend line bullish continuation pattern.
Both patterns may be useful for different traders depending on their trading strategy as they signal different possibilities for what might happen with the price of an asset. While both may signal a change in market momentum, the Descending Triangle Pattern provides more bearish indications than bullish ones, making it more suited for short-term traders looking to take advantage of bearish movements.
Tips and Strategies for Trading Descending Triangle Pattern

If you’re interested in trading the descending triangle pattern, understanding the basics is key. This pattern is recognizable by two trend lines – one flat support line across the bottom and one steadily decreasing over time that both converge as time passes.
A successful strategy for trading this pattern involves watching for a breakout point above or below these converging trend lines that signals a buy or sell opportunity respectively. It’s important to remember that with any type of trading, having a risk management strategy in place is paramount to success.
When it comes to the descending triangle chart pattern specifically, it may be wise to watch for higher volume at certain points along the breakout before investing funds to have more confidence in your decision. With patience and an understanding of market conditions, trading descending triangle patterns can be profitable but always make sure you understand the risks before investing significant amounts of money.
FAQS
What is a descending triangle pattern?
The descending triangle pattern is a bearish continuation pattern identified by a horizontal support level and a descending trendline.
How is the pattern formed?
The pattern is formed when the price creates a series of lower highs and bounces off a horizontal support level multiple times, creating a descending trendline.
What does the pattern indicate?
The pattern indicates that the sellers are gaining control and that the price is likely to continue lower after a confirmed breakout below the support level.
Is fundamental analysis important when trading the pattern?
Yes, fundamental analysis can provide valuable insights into the underlying reasons for the price movement and help traders make informed trading decisions.
Difference between Descending and Ascending triangle patterns?
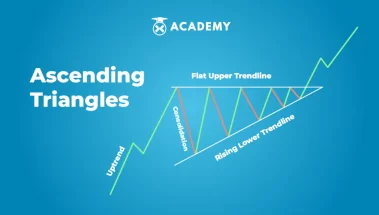
Descending triangle has a descending upper trendline with a horizontal support level, indicating a bearish pattern, while ascending triangle pattern has a rising trendline with a horizontal resistance level, indicating a bullish pattern.
Conclusion
In conclusion, the descending triangle is a common chart pattern in technical analysis that can provide valuable information to traders. It is identified by a horizontal support level and a descending trendline, which creates a bearish continuation pattern.
Traders can use technical analysis to identify the pattern, analyze its price projection, and develop trading strategies based on it. Combining the pattern with other technical indicators and fundamental analysis can provide additional confirmation and improve trading performance.
Risk management is crucial, and traders should always practice responsible trading and have a clear understanding of the risks involved.
By following these tips and strategies, traders can potentially take advantage of the descending triangle pattern to make informed trading decisions.



 By:
By:


