 By:
By:
Key Takeaways
- Reversal trading is a strategy that can be used by traders in order to capitalize on the reversal of a trend.
- A reversal occurs when the direction of price movement changes, and this can happen in either an uptrend or downtrend.
- The most important thing to remember when reversal trading is that reversals can be difficult to predict and as such, traders should always wait for confirmation before entering into any trades.
- There are a few signs that a reversal may be about to occur. These include things like the price breaking through a previous resistance or support level, or the appearance of reversal candlestick patterns.
- The best time frame to trade reversals will depend on the trader’s individual preferences. Some traders may prefer to trade market reversals on longer time frames, while others may prefer shorter time frames in order to get into trades more quickly.
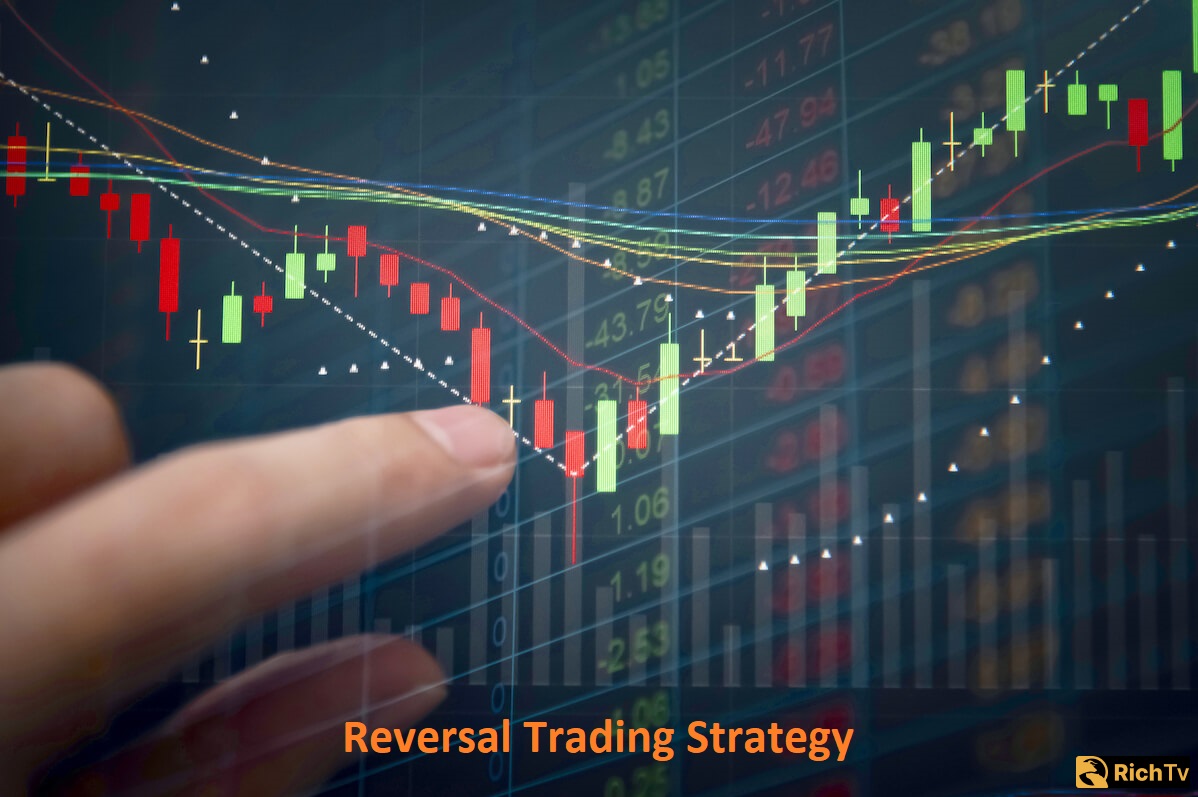
Reversal trading is a strategy that can be used by traders in order to capitalize on the reversal of a trend. A reversal occurs when the direction of price movement changes, and this can happen in either an uptrend or downtrend. In this blog post, we will discuss what constitutes a reversal trading strategy, as well as the significance of using such a strategy. We will also look at some indicators that can help you spot reversals, as well as tips for managing risk when employing this approach.
What is a reversal trading strategy?
A reversal trading strategy is one that seeks to take advantage of price reversals. A reversal can occur in either an uptrend or downtrend, and it happens when the direction of price movement changes.
Reversal trading strategies seek to enter into positions when such a change takes place, in order to profit from the ensuing price movement.
The significance of employing a reversal trading strategy
There are several reasons why reversal trading strategies can be advantageous for traders. First of all, reversals often lead to sharp price movements, which can provide ample opportunities for profits. Secondly, by entering into trades when a reversal is taking place, traders can avoid getting caught up in false breakouts, which often occur during extended trends. Finally, reversals can offer a good opportunity to enter into trades with low risk, as the stop-loss can be placed below/above the reversal candle (depending on the direction of the trade).
Factors to consider before reversal trading
There are a few things that need to be in place before you start reversal trading.
- Firstly, there needs to be a clear trend that is underway. This could be an up trend or down trend, but it should be well-established and easy to identify.
- Secondly, there needs to be a sign or indications that the trend is beginning to reverse. This could come in the form of a candlestick pattern, a change in momentum, or any other number of technical analysis indicators.
- Finally, the trader needs to have an idea of where they would enter and exit the trade.
Once all of these factors are in place, the trader can then start to look for reversal trading opportunities. When spotting a potential opportunity, it is important to remember that reversals can often be false starts.
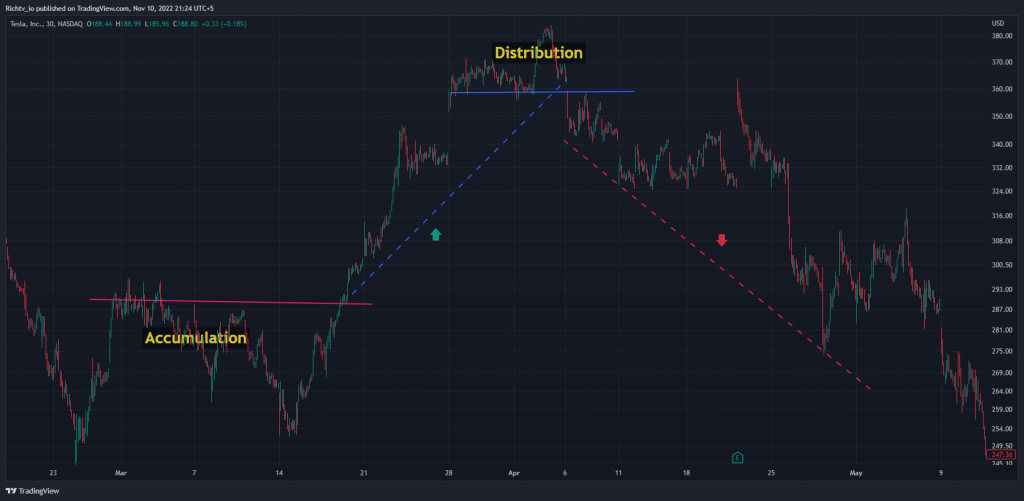
As such, it is important to wait for confirmation before entering into any trades. One way to do this is to wait for the price to break out of a previous resistance or support level. This can act as a confirmation that the trend has truly reversed.
Simple steps for predicting a reversal
There are a few key things that you will want to look for when trying to predict a reversal. First of all, you should look for a change in the direction of price action. This can be seen on a candlestick chart, and it is often accompanied by a change in momentum.
Another thing to look for is a change in market structure. This means that the highs and lows are no longer forming in the same pattern as they were previously.
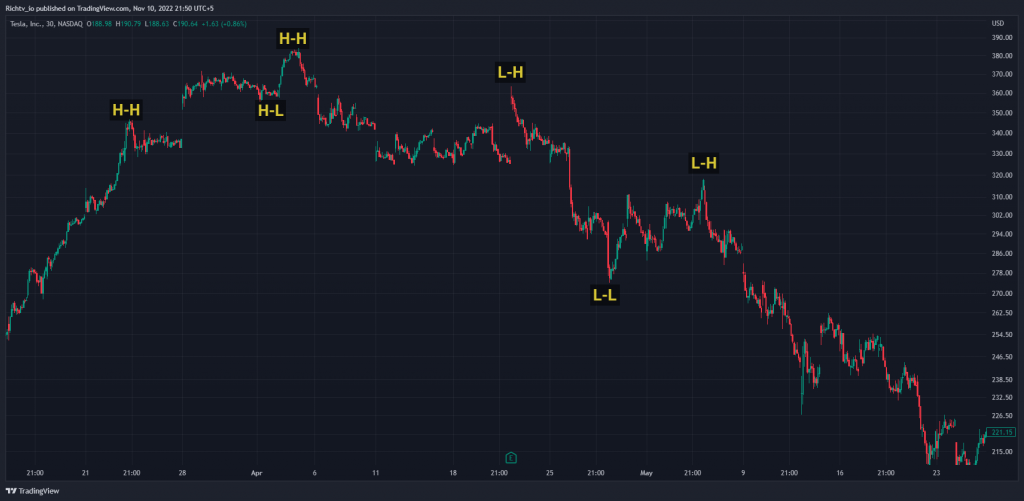
For example, if the market was previously in an uptrend, but you now see a series of lower highs being formed, this could be indicative of a reversal.
Finally, you should also pay attention to divergences on your indicators. A divergence occurs when the indicator moves in the opposite direction of price action.
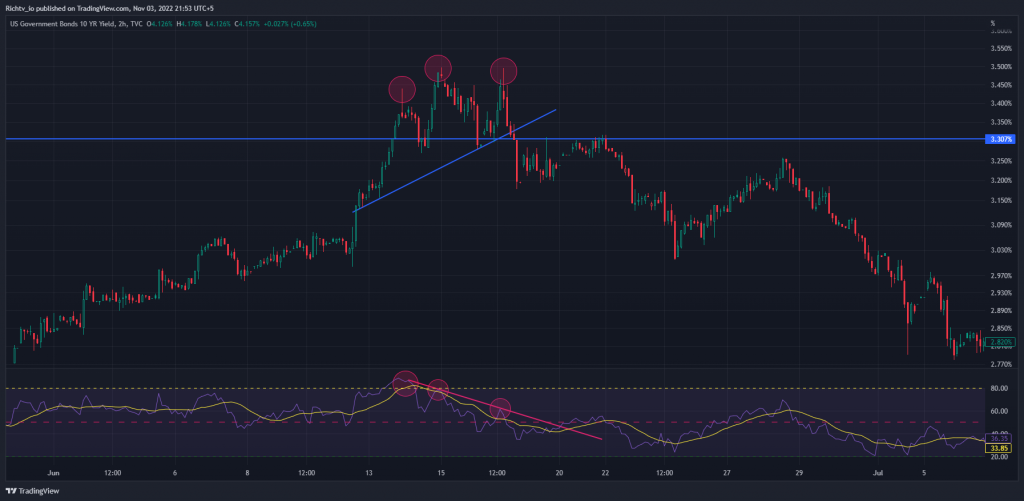
For example, if price action is making higher highs, but the RSI is making lower highs, this could be an indication that a reversal is about to take place.
Where a reversal trading can be applied
When it comes to trading, the concept of a reversal can be applied to any time frame. However, when looking at longer-term charts, reversals tend to occur less frequently than on shorter-term timeframes.
As such, reversal trading may only be employed once every few months or years, rather than on a daily or weekly basis. Nevertheless, when a reversal does occur, it can offer an opportunity to profit from the change in price direction.
What we look for in reversals
When looking for potential reversals, we typically look for two things:
- A change in momentum: This can be seen on indicators such as the RSI and Stochastic Oscillator, as mentioned above.
- A change in trend: This can be seen on indicators such as the MACD, as well as on price charts (e.g. a candlestick reversal pattern).
Indicators that help spot reversals
There are several indicators that can be used to identify potential reversals. Some of the most popular ones include:
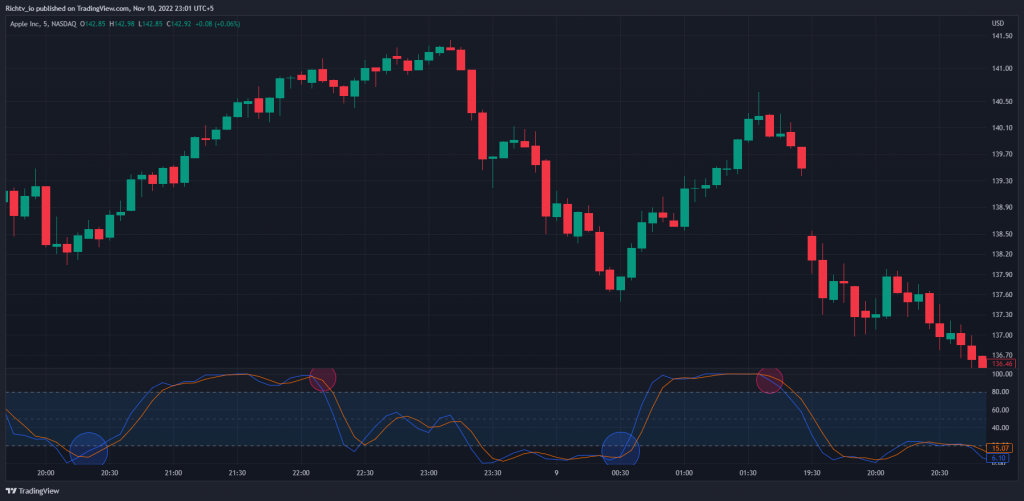
- The Relative Strength Index (RSI): The RSI is a momentum indicator that measures whether the current price is overbought or oversold. An RSI reading above 70 indicates that the market is overbought, while a reading below 30 indicates that it is oversold. A reversal is often seen when the RSI moves from one extreme to the other.
- The Stochastic Oscillator: The Stochastic Oscillator is another momentum indicator, which measures whether the current price is overbought or oversold. Like the RSI, a reading above 80 indicates that the market is overbought, while a reading below 20 indicates that it is oversold. A reversal can often be seen when the Stochastic Oscillator moves from one extreme to the other.
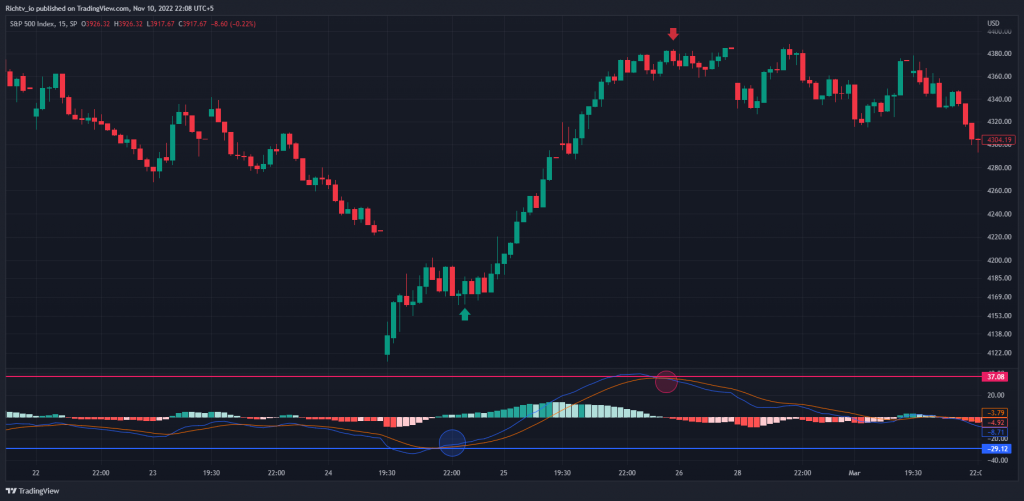
- The MACD (Moving Average Convergence Divergence): The MACD is a trend-following indicator that measures the difference between two moving averages. A bullish reversal is often seen when the Moving Average Convergence Divergence line crosses above the signal line, while a bearish reversal is often seen when the Moving Average Convergence Divergence line crosses below the signal line.
Candlesticks Reversal Patterns
There are several candlestick patterns that can be used to identify potential reversals. Some of the most popular ones include:
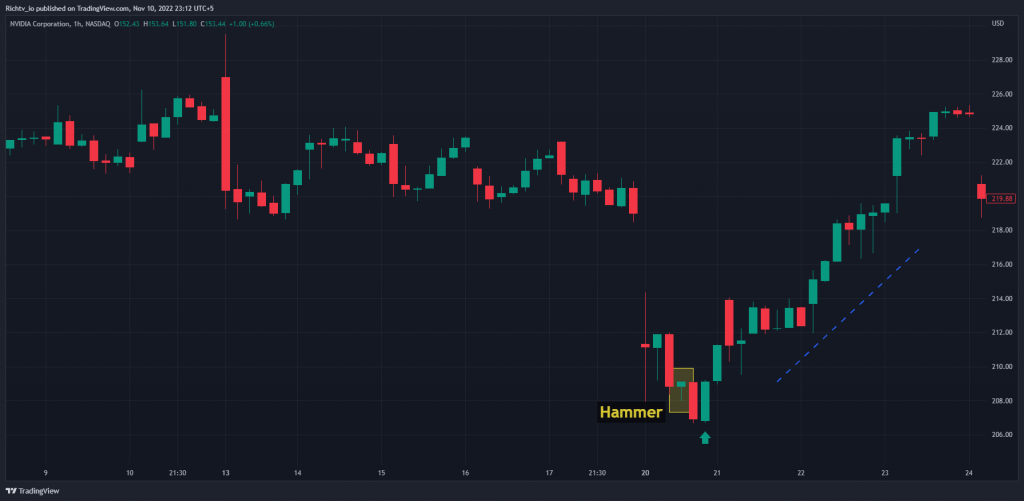
- The hammer: The hammer is a bullish reversal pattern that forms after a period of decline. It is characterized by a small body with a long lower shadow. This indicates that although the market has been falling, buyers have been able to push the price back up towards the open.
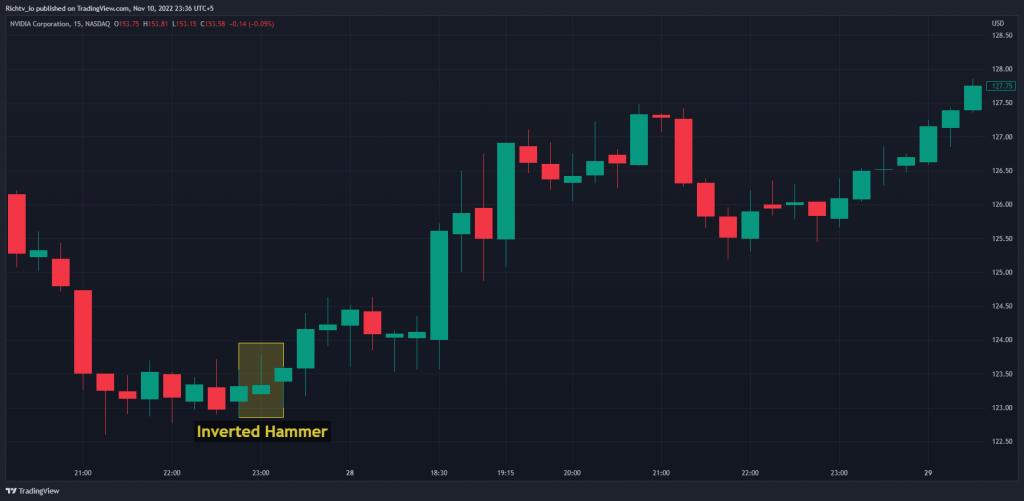
- The inverted hammer: The inverted hammer is a bearish reversal pattern that forms after a period of advance. It is characterized by a small body with a long upper shadow. This indicates that although the market has been rising, sellers have been able to push the price back down towards the close.
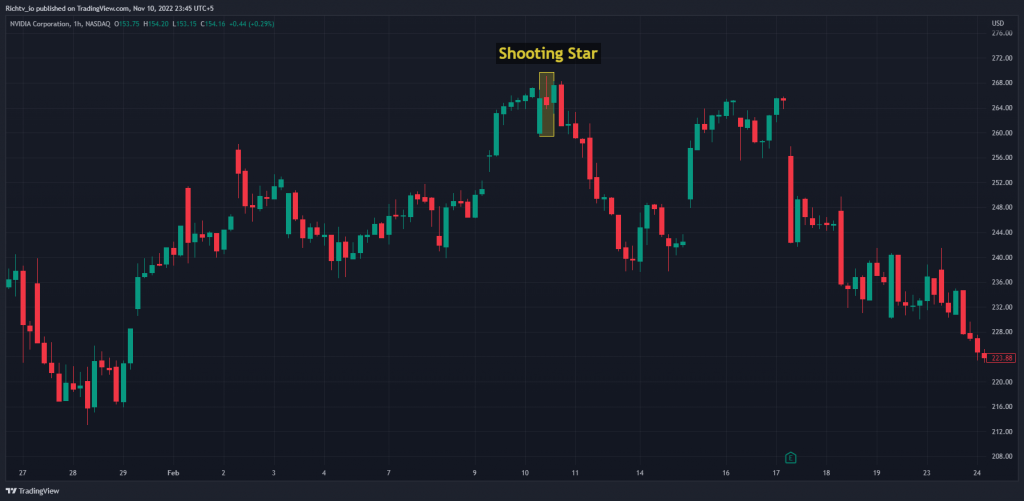
- The shooting star: The shooting star is a bearish reversal pattern that forms after a period of advance. It is characterized by a small body with a long upper shadow and no lower shadow. This indicates that buyers were unable to push the price higher, and that the market is likely to reverse lower.
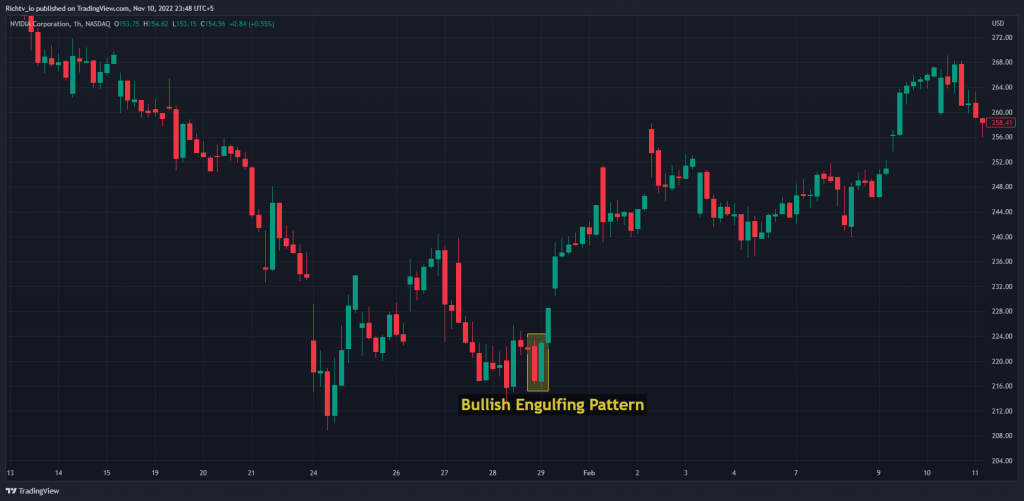
- The bullish engulfing pattern: The bullish engulfing pattern is a two-candle pattern that can signal a reversal from bearish to bullish. It is characterized by a small black candle being followed by a large white candle, which “engulfs” the prior candle. This indicates that sellers were initially in control, but that buyers were able to take over and push prices higher.
Risks involved in trend reversal trading
Every trading strategy involves risk, and trend reversal trading is no different. One of the biggest risks is that of a false start. This is when it looks like the trend is about to reverse, but then it doesn’t and the price continues in the original direction. This can often lead to traders taking losses as they enter into trades too early.
Another risk involved in trend reversal trading is missing the opportunity altogether. This can happen if the trader fails to spot the signs of a potential reversal, or if they enter into their trade too late. By waiting for confirmation before entering into any trades, traders can help to mitigate this risk.

Lastly, there is always the risk that the market may not actually reverse at all. This is often the case when there are strong fundamentals in place that are driving the market in a certain direction. In these instances, it is often best to wait for a better opportunity rather than trying to pick a top or bottom.
Despite the risks involved, trend reversal trading can be a highly profitable strategy if executed correctly.
By waiting for confirmation before entering into any trades, and by carefully managing risk, traders can help to ensure that they are successful in this strategy.
Tips for managing risk when engaging in reversal trading
When employing a reversal trading strategy, it is important to manage risk properly. Some tips on how to do this include:
- Placing stop-losses below/above key support/resistance levels: This will help to limit losses in case the reversal does not take place.

- Only taking trades that offer a good risk-reward ratio: This means that the potential profit should be at least two times the size of the potential loss.
- Not over-leveraging: This means not putting too much money into a single trade, as this can lead to large losses if the trade goes against you.
By following these tips, you can help to ensure that reversal trading is performed in a way that is both effective and efficient.
Frequently Asked Questions
What is trend reversal trading?
Trend reversal trading is a strategy that looks to take advantage of price reversals. This could be in the form of an up trend reversing into a down trend, or vice versa. Reversal day trading strategies often aim to enter into trades at the start of the reversal, and then hold on until the trend has reversed.
What are some of the risks involved in trend reversal day trading?
There are a few risks involved in reversal day trading. Firstly, there is the risk of a false start.
- This is when it looks like the trend is about to reverse but then doesn’t and continues in the original direction.
- Secondly, there is always the risk that the market may not actually reverse at all. This is often the case when there are strong fundamentals in place that are driving the market in a certain direction.
- Lastly, there is the risk of missing the opportunity altogether if the trader fails to spot the signs of a potential reversal.
How can I manage risk when reversal trading?
There are a few things to keep in mind when it comes to managing risk when reversal trading.
- Firstly, it is important to use stop-loss orders in order to protect your capital.
- Secondly, traders should always aim to take profits at a 1:1 ratio or higher. This means that for every dollar you risk, you should look to make at least one dollar in profit.
- Finally, it is important to remember that reversals can be difficult to predict and as such, they should only ever form a small part of your overall trading strategy.
What are some signs that a reversal may be about to occur?
There are a few signs that a reversal may be about to occur. These include things like the price breaking through a previous resistance or support level, or the appearance of reversal candlestick patterns.
Other indicators that can be used to spot reversals include momentum indicators and MACD.
What are some tips for spotting reversals?
Some tips for spotting reversals include paying attention to price action, using technical analysis indicators, and being aware of key support and resistance levels.
It is also important to remember that reversals can be difficult to predict and as such, traders should always wait for confirmation before entering into any trades.
What is the best time frame to trade reversals?
The best time frame to trade reversals will depend on the trader’s individual preferences.
Some traders may prefer to trade market reversals on longer time frames, such as the daily or weekly charts, in order to avoid false starts. Others may prefer to trade market reversals on shorter time frames, such as the 1-hour or 4-hour charts, in order to get into trades more quickly.
Ultimately, it will come down to what works best for the individual trader.
What are some common mistakes that traders make when reversal trading?
Some common mistakes that traders make when reversal trading include failing to wait for confirmation, chasing prices, and not managing risk properly. It is also important to remember that market reversals can be difficult to predict and as such, they should only ever form a small part of your overall trading strategy.
Is reversal trading profitable?
Reversal trading can be profitable if done correctly. However, it is important to remember that market reversals can be difficult to predict and as such, they should only ever form a small part of your overall trading strategy.
What is the most important thing to remember when trend reversal trading?
The most important thing to remember when reversal trading is that reversals can be difficult to predict and as such, traders should always wait for confirmation before entering into any trades.
Additionally, it is important to manage risk properly and to take profits at a 1:1 ratio or higher.
Conclusion
Trend reversal trading can be a profitable strategy if done correctly. However, it is important to remember that reversals can be difficult to predict and as such, they should only form a small part of your overall trading strategy.
When trend reversal trading, it is crucial to wait for confirmation before entering into any trades and to manage risk properly.
Additionally, take profits at a 1:1 ratio or higher. By following these tips, you can become a successful reversal trader.