 By:
By:

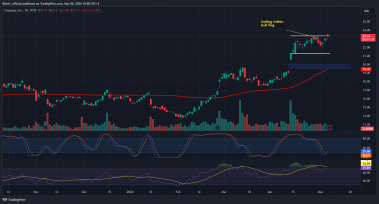
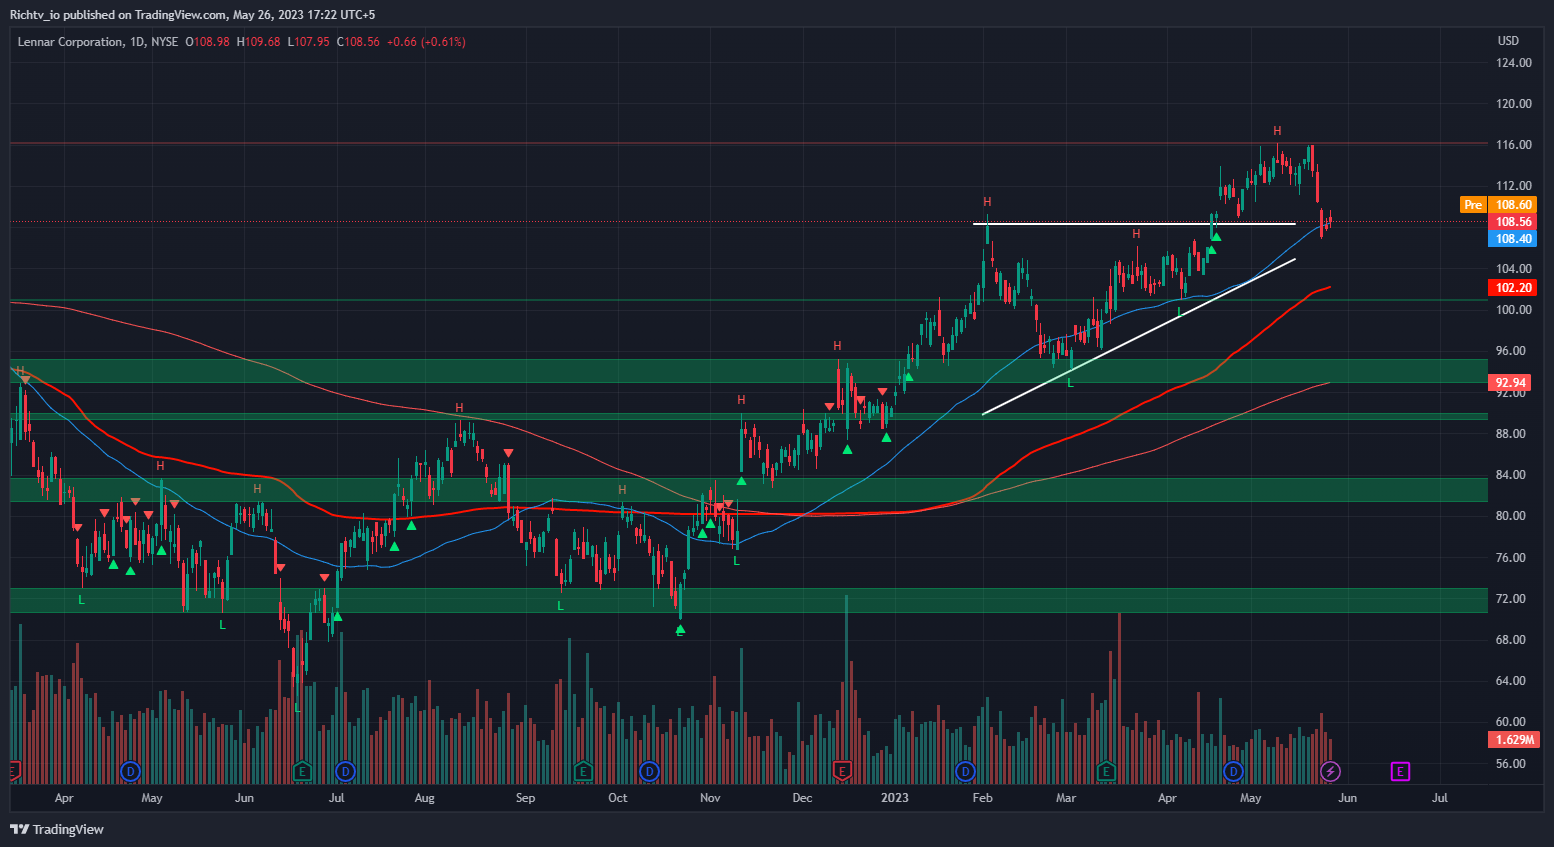
Lennar Corporation (LEN: NYSE)
Good news for homebuilders! Lumber prices have come down significantly from their peak in March 2021, which means lower input costs and higher margins. This is excellent news for Lennar and other homebuilders who haven’t cut their home prices yet. At the same time, there’s still a great demand for housing, keeping the housing market afloat despite mortgage rates hovering at multi-year highs. Lennar expects flat demand in 2023 like other homebuilders, but they can still grow profits and earnings through their margins instead of home sale volume.
With all these factors in mind, we believe that Lennar Corporation (LEN) is poised to do well beyond the $100.00-$102.00 range, with a potential upside target of $160.00-$165.00.
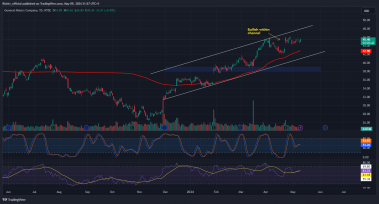
NVIDIA Corporation (NVDA: NASDAQ)
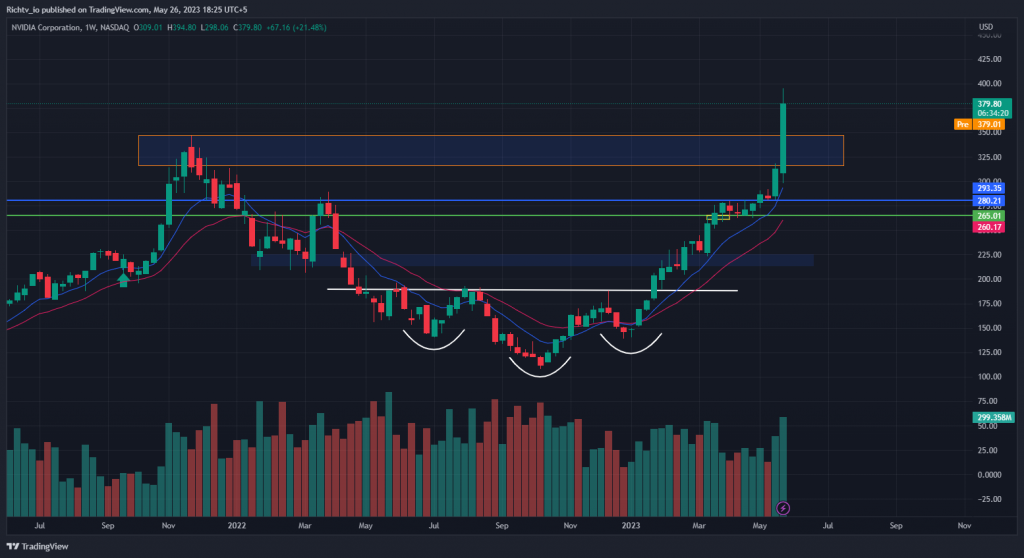
On the weekly timeframe you can see that Nvidia just perfectly broke above the previous all-time-high which we created back in November of 2021 at the $340 level.
Nvidia just generated a rally of 250% without any real correction, so we are now simply waiting for a retest of the previous all-time high before we do expect more continuation towards the upside. You can also see that from a weekly perspective, Nvidia stock is a little bit overextended towards the upside.
We are currently just waiting for any sort of a distribution phase as the Nvidia stock is dramatically gapping up today on the daily timeframe with a gap of 25%, breaking all resistance to the upside.
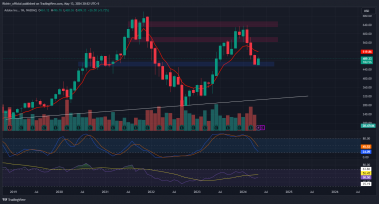
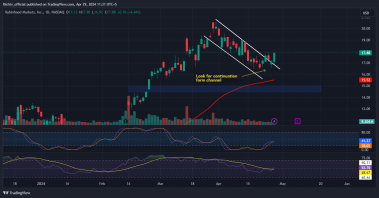
BTC/USD
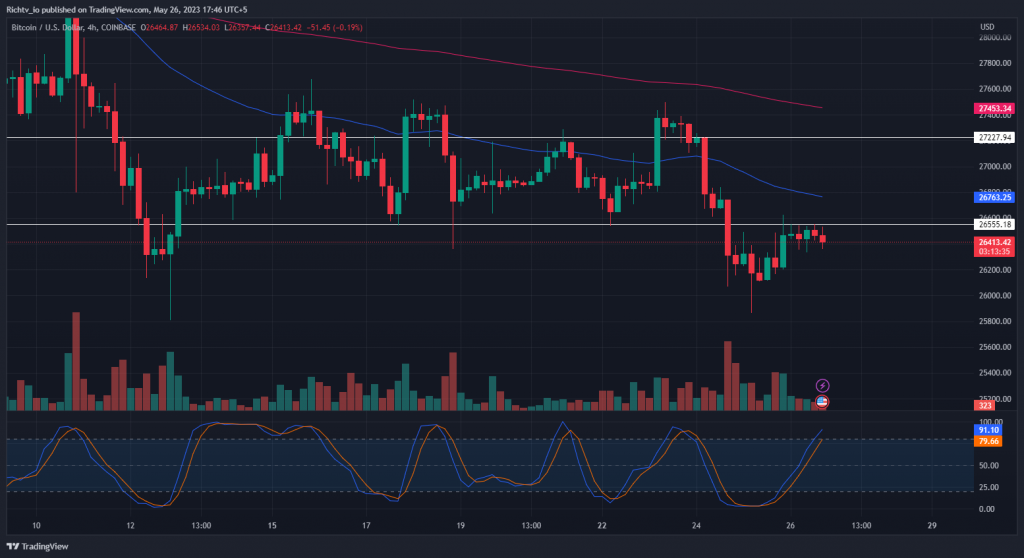
The previously established range low, which is now serving as underbelly resistance, seems to be acting as resistance for Bitcoin.
Current bearish formation is formed by the crossing of the 50-day (blue) and 200-day (red) exponential moving averages (EMAs), which suggests likely continuation of the downward momentum. Moreover, the widening gap between those EMAs suggests that bears are taking back full control!
Any current price bounce may only be a short squeeze caused by the stochastic RSI’s impending peak and potential rollover, but those shorts will simply reload from higher up.
Bitcoin Dominance (BTC.D)
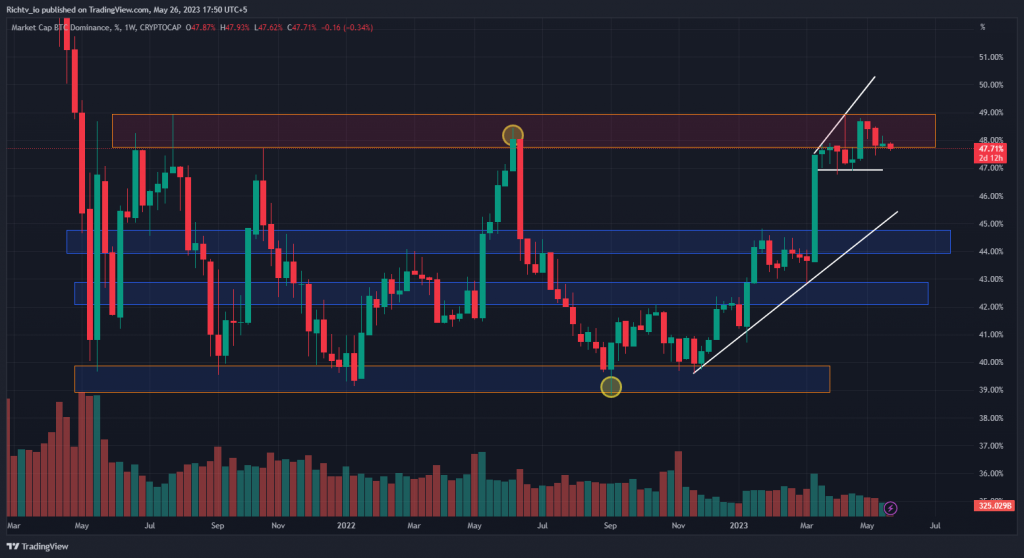
Bitcoin Dominance (BTC.D) has varied between 39% and 49% over the last two years. BTC.D outperformed the overall altcoin market during the past six months, rising from the low end of this range (39%) to the top end (49%). BTC.D has failed in its last two efforts to surpass 49% and is currently sitting at 47.71%.
If BTC.D maintains its downward trajectory, it might get close to a significant support zone between 44% and 45%. This could signal a potential shift in investment from Bitcoin to altcoins, which would be advantageous for the overall alt market.
However, if BTC.D breaks through the major resistance level of 49%, it will face the next resistance beginning at 51%.