 By:
By:

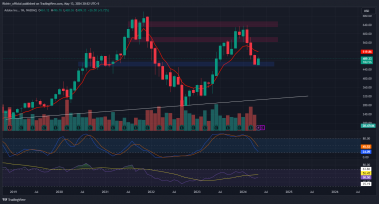
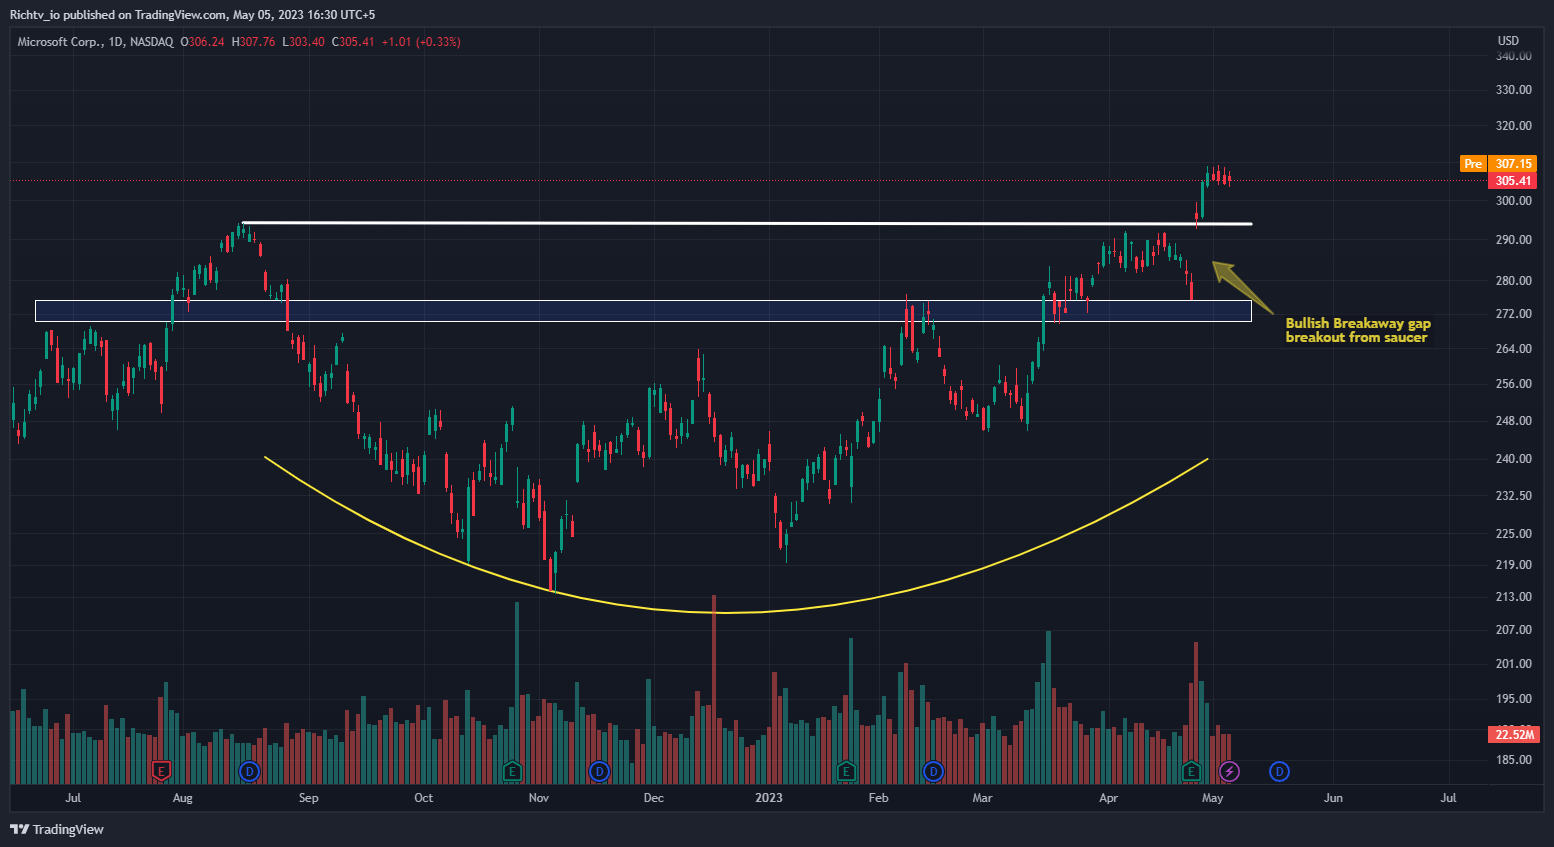
Microsoft (MSFT:NASDAQ)
Microsoft’s Azure division has certainly been making waves recently with its impressive Q1 revenue growth of 31%. In fact, the division’s success was a key contributor to MSFT’s overall 2% uptick in revenue during Q2. But it’s not just cloud computing that Microsoft is investing in; the tech giant also injected $1 billion into OpenAI back in 2019 and there are rumors that it could add another $10 billion to the start-up’s funding.
Investors seem to be taking note of Microsoft’s success and potential, with some predicting an upside target of $370.00-$380.00, provided the stock remains above $270.00-$275.00. Needless to say, the future looks bright for Microsoft.
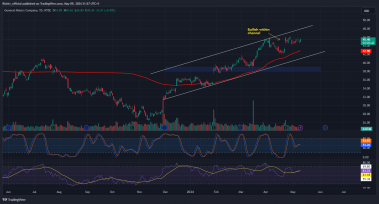
Stellantis (STLA:NYSE)
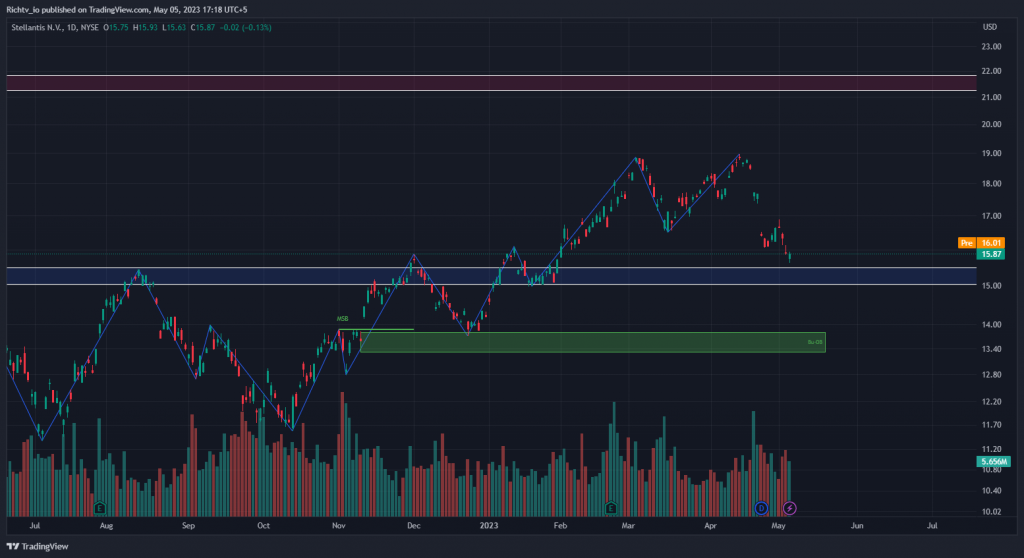
Stellantis, the global automotive giant, is making waves in the electric vehicles market with a staggering 40% increase in sales in the fourth quarter last year. As the industry races towards a sustainable and eco-friendly future, the company has made significant investments to back up its ambitious goals. Recently, STLA poured $150 million into an Argentine copper mine to secure the precious raw materials needed for mass production of electric vehicles.
With its sights set firmly on achieving net-zero carbon emission by 2038, STLA is shaping up to be one of the top players in the EV space. With this impressive momentum, analysts are predicting a bright future for STLA with potential for a price surge up to $20.00-$22.00, making it a bullish investment.
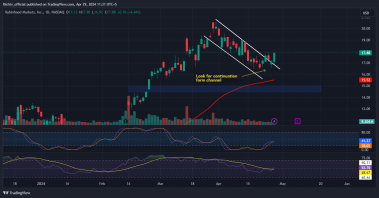
BTC/USD
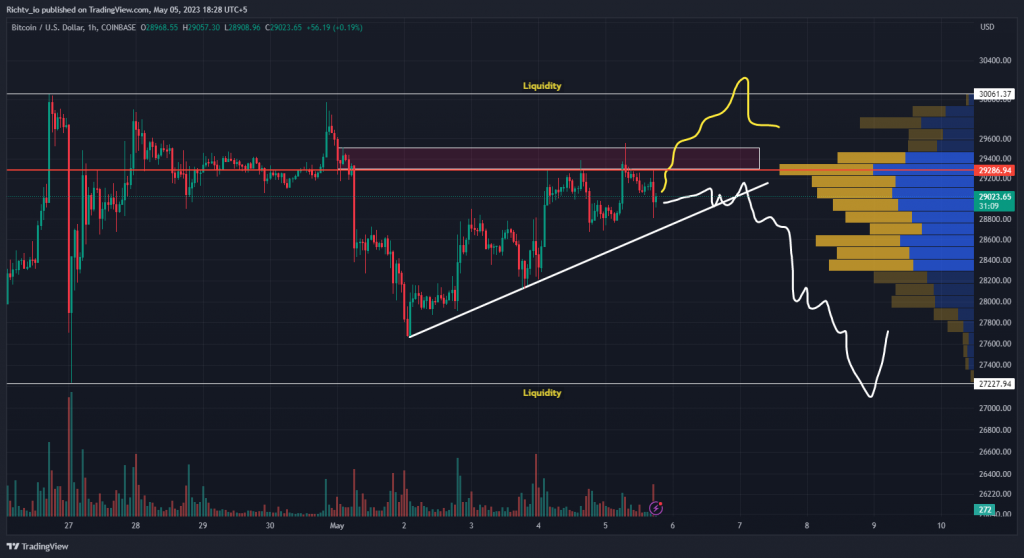
With the point of control at $29,286 and signifying a minor liquidity zone, Bitcoin is currently entrapped below the pink-highlighted box. The price immediately surged through that level and then instantly rejected, as seen on the previous candles.
I’ve listed two possible paths:
A short trade with a stop above the wick at $29,600 and a target at the lower liquidity level of $27,227 would be initiated if the price continued to fall below the diagonal trend line, as shown by the white lines. If this level is broken, the price may re-enter the range and offer a long trade opportunity.
The yellow lines, on the other hand, suggest that the price may be aiming for greater liquidity. We won’t short in this situation right away; instead, we’ll wait and see how the price responds and whether it enters the range again. Execution of a short transaction is possible once the price is accepted back inside the range.
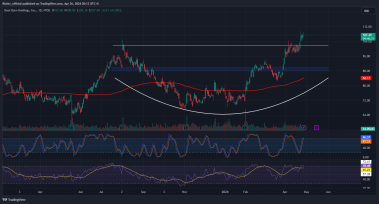
ETH/USDT
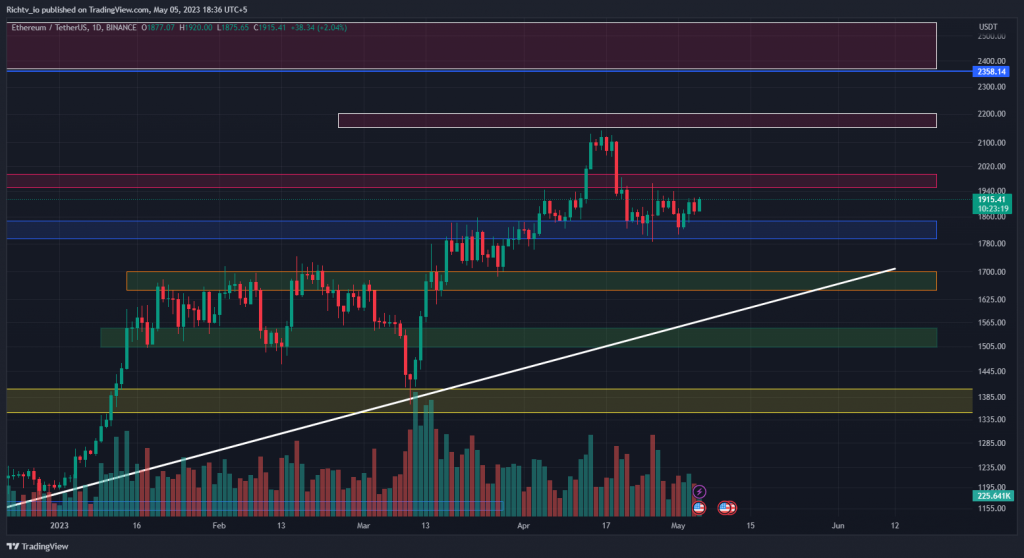
Along with the majority of other coins, ETH has been consolidating and trading in a narrow range for the previous two weeks.
While BTC and the TOTAL have both established pennant formations on the 8-hour chart, indicating an impending decision on the direction of the market, ETH’s price has been bouncing between strong support at $1,800 and resistance around $1,900.
When bitcoin breaks above its current price, it is likely that ETH will do the same, maybe testing the next resistance levels between $1,950 and $2,000 or even breaking through to the next resistance level between $2,150 and $2200. The next support range, however, is between $1,800 and $1,850 if the price of ETH declines from its present level of $1,900. If this support fails the next major support range is located between $1,650 and $1,700.
The daily support line, which starts in November, is also a little bit lower at little about $1,600. If the price were to test that range, this level would also be a key support level.