 By:
By:

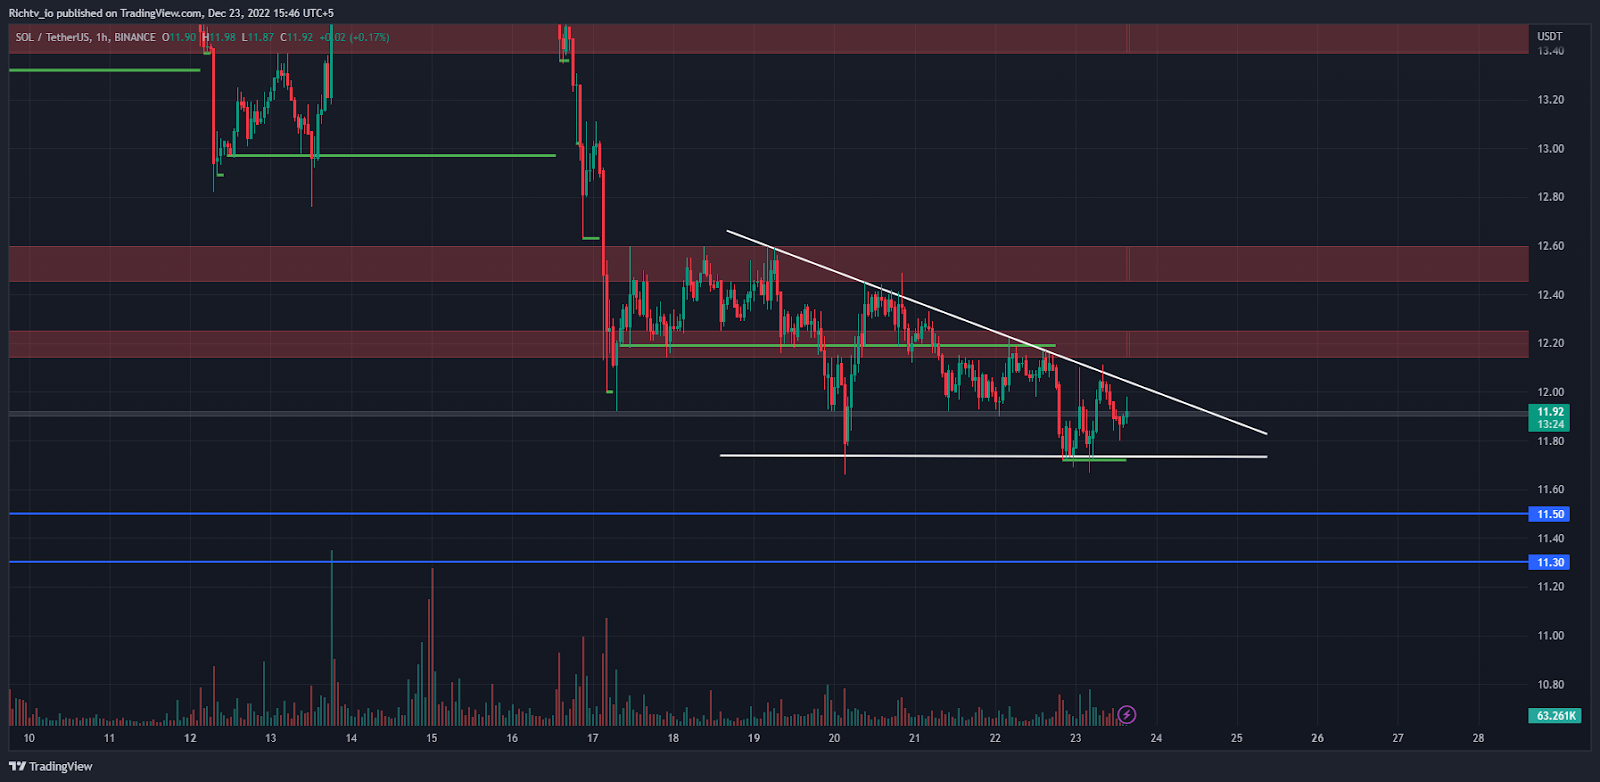
SOL/USDT
For trading on SOL/USDT, the price is forming a bearish descending triangle pattern. Analysts are expecting a breakdown of the lower border of this pattern, which would likely pressure the price to drop to around $11.5-11.3 in the near future.
This could be an ideal trading opportunity for those who can recognize patterns and execute well-timed trading decisions. The key will be to adopt the right trading strategy at the right time which could add value by perfectly capturing market sentiments and potential profits.
BTC/USDT
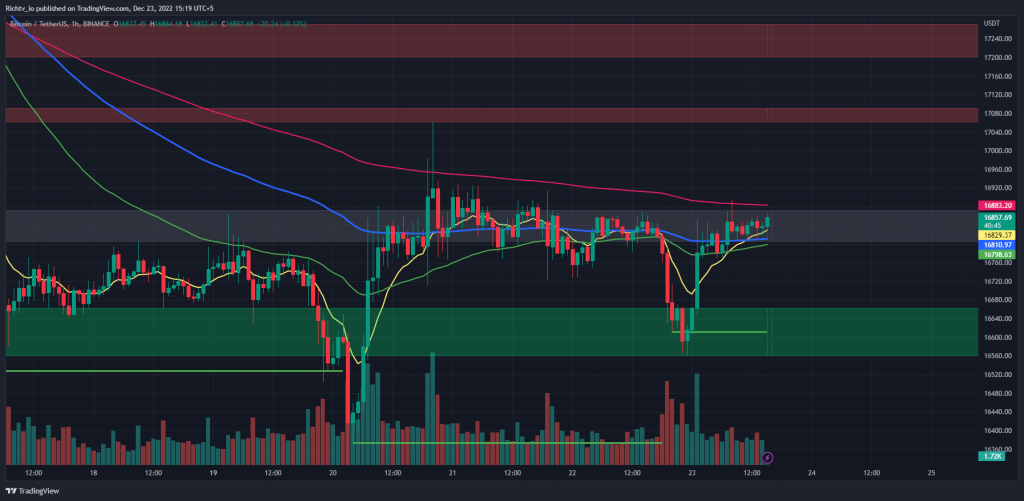
Bitcoin trading is a risky game and it’s important to have knowledge of the market before engaging in any trades. Bitcoin (BTC) is currently trading at $16839 and has support at $16500 and $16000, with resistance at $17000 and $17500.
Looking closer in the 1 hour time frame, BTC is trying to get a bounce back from its EMA100. If volume comes in, BTC has a chance of testing its EMA200 resistance at $16900.If BTC fails to hold its EMA10 support then it could test its EMA50 level of $16798.
Trade carefully and manage your risk according to the mentioned support and resistance levels.
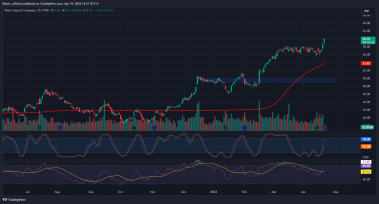
ADA/USDT
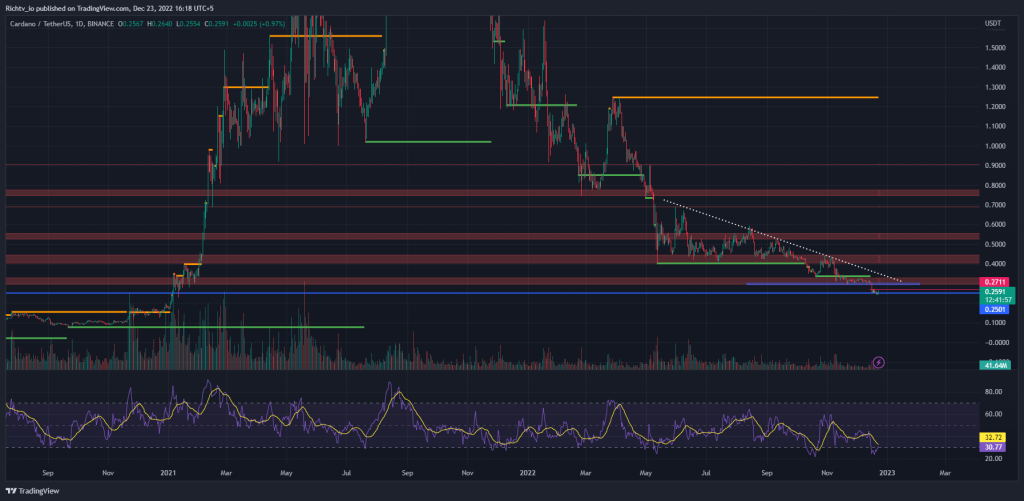
ADA has been holding well above the marked trend-line support, giving investors hope of further gains. While the market indicates that we are in an oversold region, what is most promising is that ADA appears to be forming a bullish divergence. For traders and investors alike, strong confirmations of bullish trends begin with a close above the lower high of $0.2711 being achieved.
The volume profile showing power lows may also provide additional support that strengthens this notion should it be realized. Inevitably, without a successful close above this key level, investors could find themselves facing a bearish reversal or worse still a period of consolidation. Therefore, all eyes will soon be on this key resistance point to determine whether ADA can reclaim its bullish momentum and make good on its positive promises!
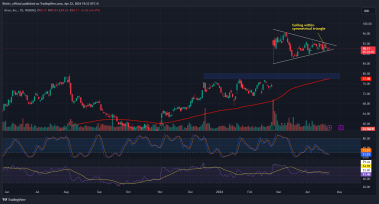
XRP/USDT
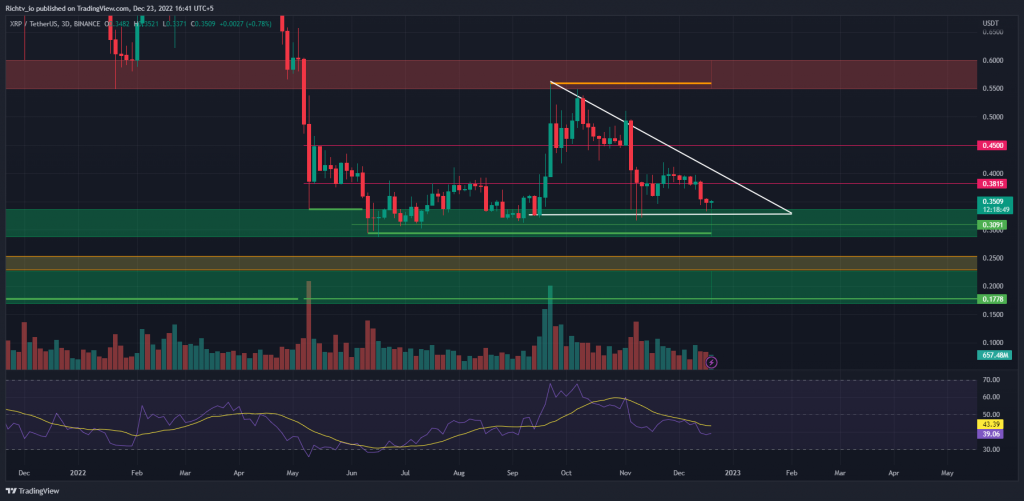
Technical indicators for xrp/usdt now show a bearish descending triangle pattern, signaling a potential downturn in the price of this cryptocurrency. A breakdown of the lower border of this triangle should suggest that prices can be expected to continue their downtrend towards $0.25.
Traders need to actively monitor xrp/usdt and adjust their strategies if they wish to remain on track with current trends and changes in market conditions.