Key Takeaways
- A bull flag is a small rectangle or consolidation that forms after an uptrend.
- The bullish flag continuation pattern can be seen on any time frame but is most often traded on the 1-hour chart or higher.
- A bull flag happens during an uptrend while a bear flag forms during a downtrend.
- To avoid failure, it’s important to wait for a confirmed breakout and use stop losses.
- There are a few different bullish flag strategies that you can use. The key is to find a strategy that suits your trading style and risk tolerance.
There is a bullish continuation pattern that is worth your attention. It goes by the name of bull flag.
In this article, we will show you what it looks like and how to trade it for maximum profit. We’ll also compare it to the bear flag pattern so you can understand the difference. Plus, we’ll give you some tips on how to use bullish flag entries and price targets effectively!
What is a “bull flag”?
A bull flag is a small rectangle or consolidation that forms after an uptrend.
The pattern typically happens near the end of an uptrend when the stock pauses to catch its breath before resuming its upward move.
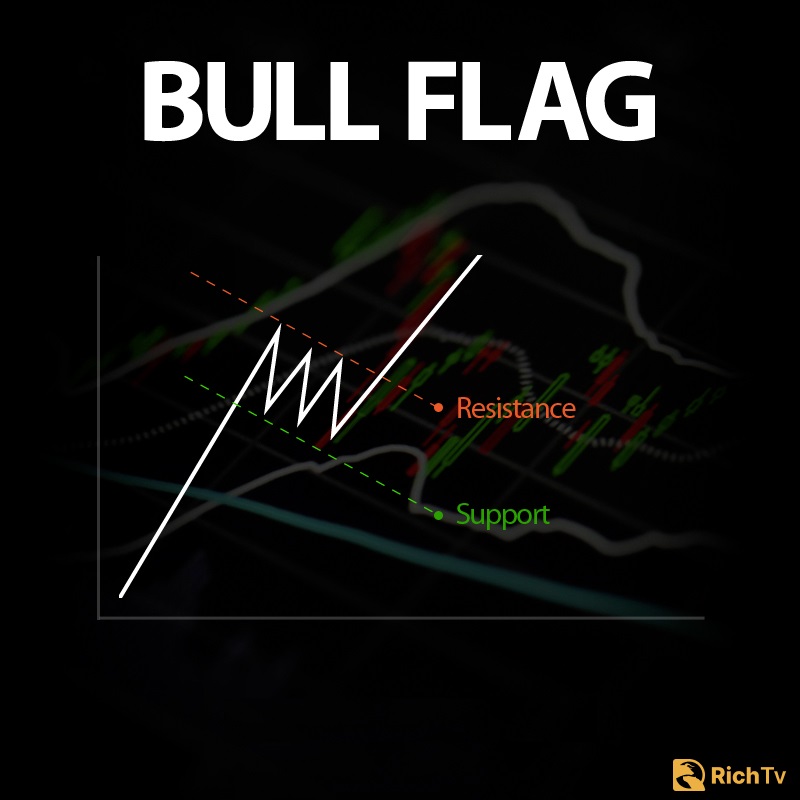
The bullish flag continuation pattern can be seen on any time frame but is most often traded on the 1-hour chart or higher.
Flag versus Pennant: Differences
The main difference between a flag and a pennant is that a flag has parallel lines while a pennant has converging lines.
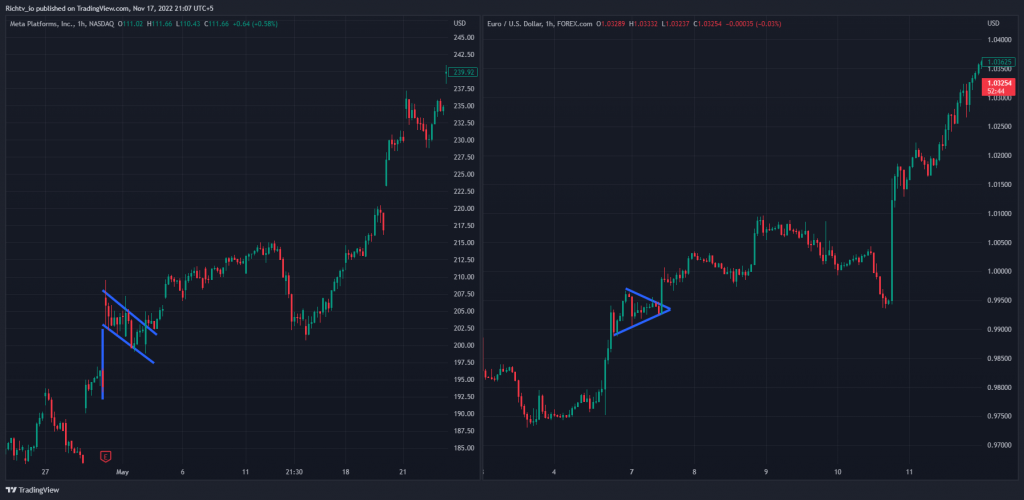
Other than that, the two patterns are very similar and have the same trading implications.
Bull flag vs Bear flag – How both differ
The main difference between a bull flag and a bear flag is the direction of the trend.
A bull flag happens during an uptrend while a bear flag forms during a downtrend.
Apart from that, the two patterns are very similar. They both form after a strong move in price followed by a period of consolidation before breaking out in the original direction of the trend.
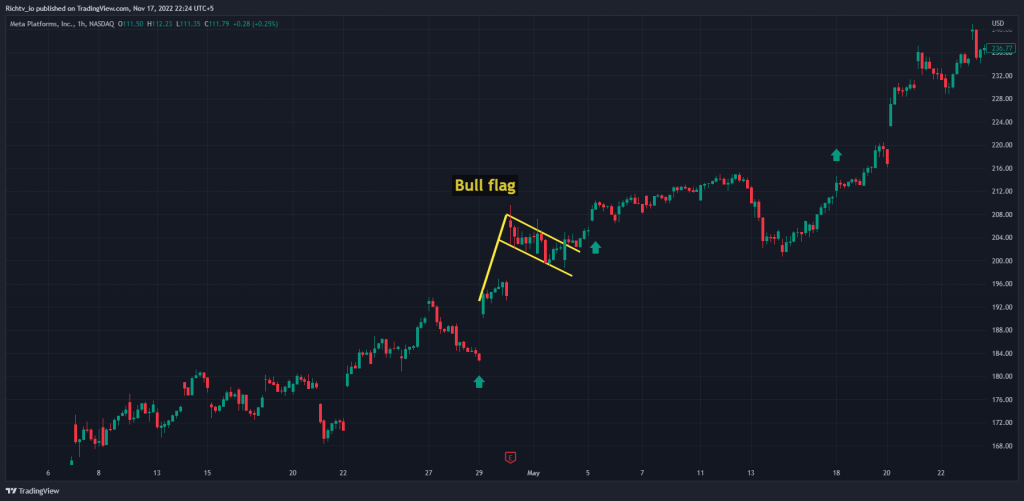
A bullish flag forms during an uptrend. There is a strong move higher followed by a period of consolidation before breaking out to the upside.
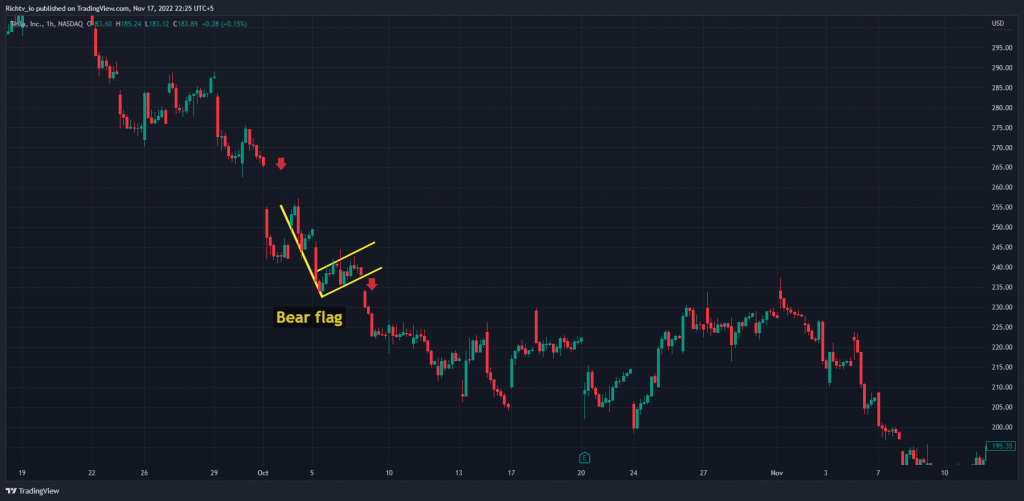
As you can see from the chart, a bearish flag forms during a downtrend. There is a strong move lower followed by a period of consolidation before breaking out to the downside.
How to identify a bull flag in real-time conditions
The first step is to identify an uptrend. This can be done by looking for a series of higher highs and higher lows. Once you have identified an uptrend, you can then look for the bullish flag pattern to form.
A bull flag pattern should form after a sharp trend move higher. The consolidation period that follows should be relatively small with tight ranges.
After the flag forms, we want to see a breakout above resistance and a continuation of the prior trend.
The below chart shows an example of how a bullish flag looks like on a price chart:
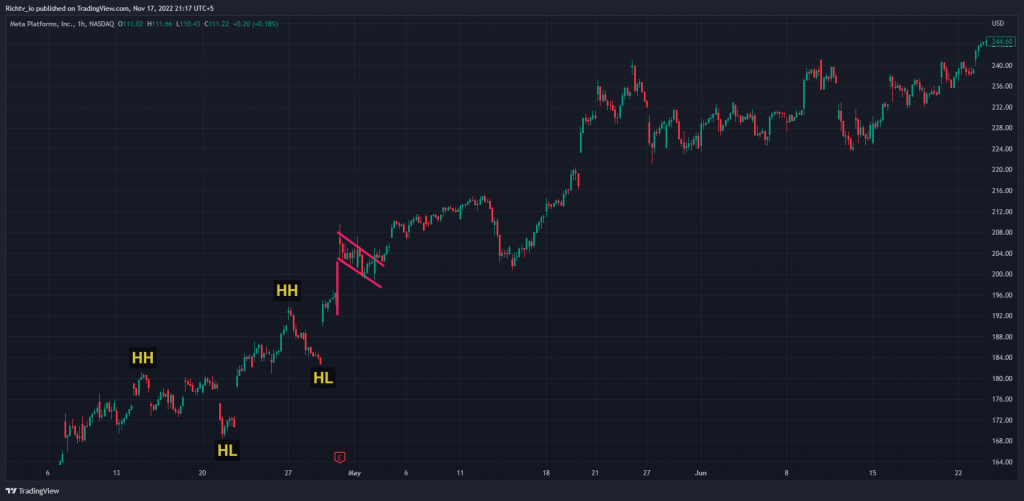
As you can see from the chart, there was a sharp rally followed by a small consolidation period (marked by the red rectangle).
The breakout above resistance confirmed the continuation of the uptrend and the stock resumed its move higher.
How to Use Bull Flag Entries and Price Targets
When trading the bull flag pattern, you want to buy when the price breaks out above resistance. Your stop loss should be placed just below support. And your profit target can be set using a measured move technique or by taking profit at the next area of resistance.
How to Trade The Bull Flag Chart Pattern
When you trade the bull flag chart pattern, you want to buy when the price breaks out above the upper resistance level of the flag. Your stop loss should be placed just below the lower support level of the flag.
As for your profit target, there are two options:
- You can take profit at the next area of resistance
- You can use a Fibonacci extension tool to identify the next likely area of resistance which is usually at the 61.8% or 100% level
The ideal time to enter a trade is on the breakout above resistance. We want to see a confirmed break before entering into positions. The stop loss can be placed below support or below the consolidation low for a more conservative stop.
Price targets can be set using a measured move technique. This simply means taking the height of the flagpole (the distance from the beginning of the uptrend to the top of the flag) and adding it to the breakout point. This gives us our price target for where we expect the stock to go.
In some cases, you may want to wait for a pullback before entering into positions. This can be done by waiting for the stock to retrace back to support and then break out again. This gives us a more favorable risk to reward ratio as we are buying closer to support.
The below chart shows an example of how this trade would look like:
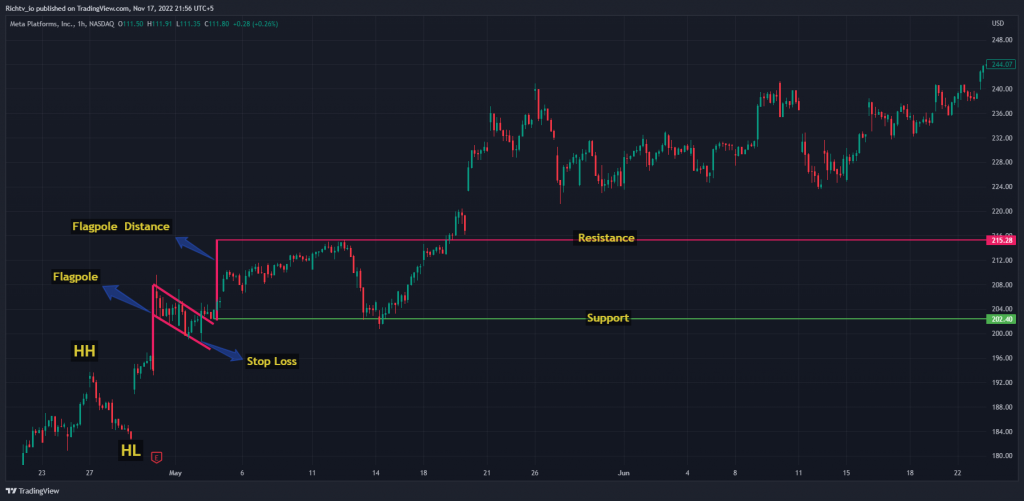
As you can see, we waited for the stock to retrace back to support before entering into positions. Our price target was hit shortly after we entered the trade.
Why is a bull flag bullish?
The answer has to do with supply and demand.
During an uptrend, the price is being driven higher by buyers (demand). When the trend pauses and forms a flag, this is simply another consolidation period where the buyers are still in control.
When the price breaks out of the flag to the upside, it’s a continuation of the previous uptrend and an indication that buyers are still in charge.
How reliable is a bull flag pattern?
The bull flag pattern is a very reliable pattern and has a high success rate.
However, like all trading chart patterns, it’s not 100% accurate and there will be losing trades. The key is to manage your risk properly and only take trades that offer a good risk to reward ratio.
Why do bull flags fail?
There are a few reasons why bull flags can fail.
One possibility is that the breakout never happens and the price just continues to consolidate. This is why it’s important to wait for a confirmed breakout before entering your trade.
Another reason is that the breakout could happen but the price then reverses and goes against you. This is why it’s important to use stop losses.
Bull Flag vs Flat Top Breakout
The main difference between a bull flag and a flat top breakout is the direction of the trend. A bull flag happens during an uptrend while a flat top breakout can happen during either an uptrend or downtrend. Beyond that, the two patterns are very similar. They both consist of a strong move followed by a period of consolidation within a well-defined flag or pennant. There will be a breakout in the same direction as the original trend once the price breaks out of the flag or pennant.
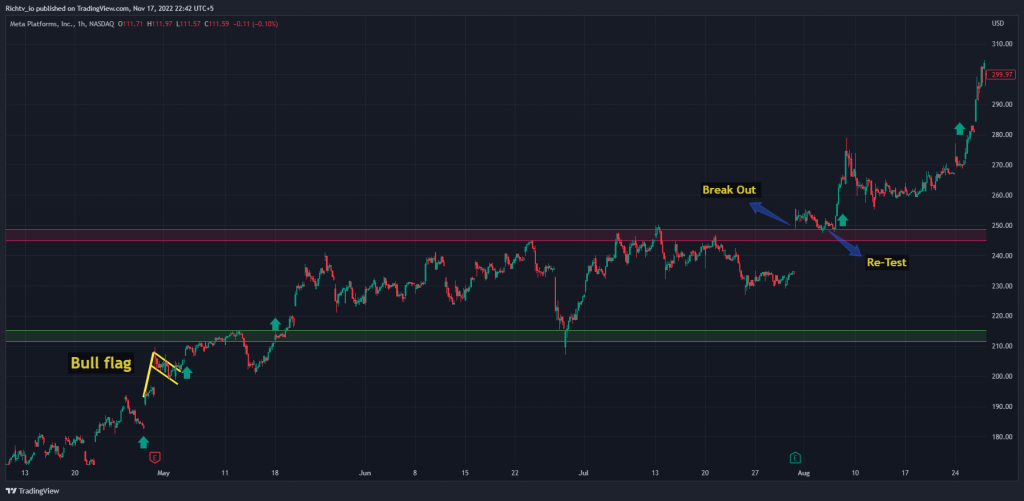
What are the Bull Flag Pattern Rules?
The bull flag pattern has a few key rules:
- There should be a strong move followed by a period of consolidation
- The consolidation should happen within a well-defined flag or pennant chart pattern
- There should be a breakout to the upside once the price breaks out of the flag or pennant
- You would enter your trade when the price action breaks out above the upper resistance level of the flag
- Your stop loss should be placed just below the lower support level of the flag
- As for your profit target, you can either take profit at the next area of resistance or use a Fibonacci extension tool to identify the next likely area of resistance
- If there is no breakout, you would simply wait for the price action to break out before entering your trade
Frequently Asked Questions
What are the common bull flag mistakes to avoid?
One of the most common mistakes made with bull flags is not using proper risk management. This includes not using stop losses or taking too large of a position size. Remember, even though the bull flag pattern is reliable, there will be times when it fails. By using proper risk management, you can protect your capital and avoid big losses.
Another common mistake is not waiting for a confirmed breakout before entering a trade. A lot of traders will enter too early and get stopped out when the price action reverses. By waiting for a confirmed breakout, you can avoid getting caught in these false breakouts.
Finally, some traders will hold onto their losing trades for too long in the hopes that the market will turn around. This almost always leads to deeper losses. If you see that your trade is not working, cut your losses and move on. There is no shame in taking a small loss. The key is to always stay disciplined with your trading.
What are the biggest risks associated with bull flag trading?
The biggest risk with bull flags is that they can sometimes fail. This means that the price action may not break out of the flag or it could break out and then quickly reverse. These failures can lead to big losses if you are not using proper risk management.
Another risk is that a bull flag pattern can take a long time to form. This means that you may have to wait a while before getting into a trade. This can be frustrating for some traders, but it is important to be patient and wait for the right setup.
Finally, bull flags tend to form during periods of high volatility. This can make them difficult to trade for some people. If you are not comfortable with trading during these periods, it may be best to avoid bull flag patterns.
What are the most popular bull flag scanners?
There are a number of different scanners you can use to find bull flag chart patterns on your charts. Some popular options include:
- StockCharts’ Pattern Recognition Scanner
- Finviz‘ Flag Patterns Scanner
- Trade Ideas‘ Bull Flag Scanner
Conclusion
The bull flag pattern is a continuation pattern that happens during an uptrend. It’s created by a strong move followed by a period of consolidation before breaking out to the upside.
The pattern is fairly reliable and has a good success rate. However, there are no guarantees in trading and there will be times when the pattern fails. The key is to manage your risk properly and always use stop losses.
There are a few different bullish flag strategies that you can use. The key is to find a strategy that suits your trading style and risk tolerance.
Please let us know if you have any questions or if you need further clarification. We hope this was helpful!


 By:
By:


