
 By:
By:

Key Takeaways
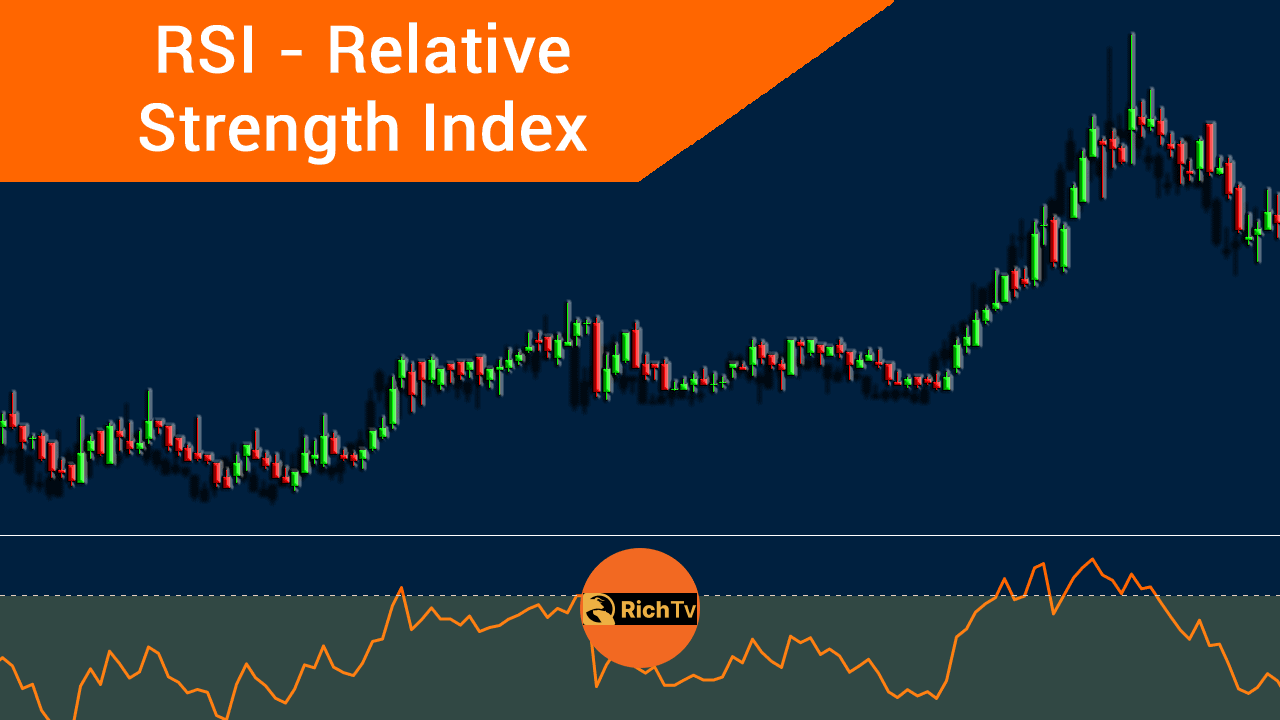
- The Relative Strength Index (RSI) is a momentum indicator that compares price increases against decreases and normalises the result to a value between 0 and 100.
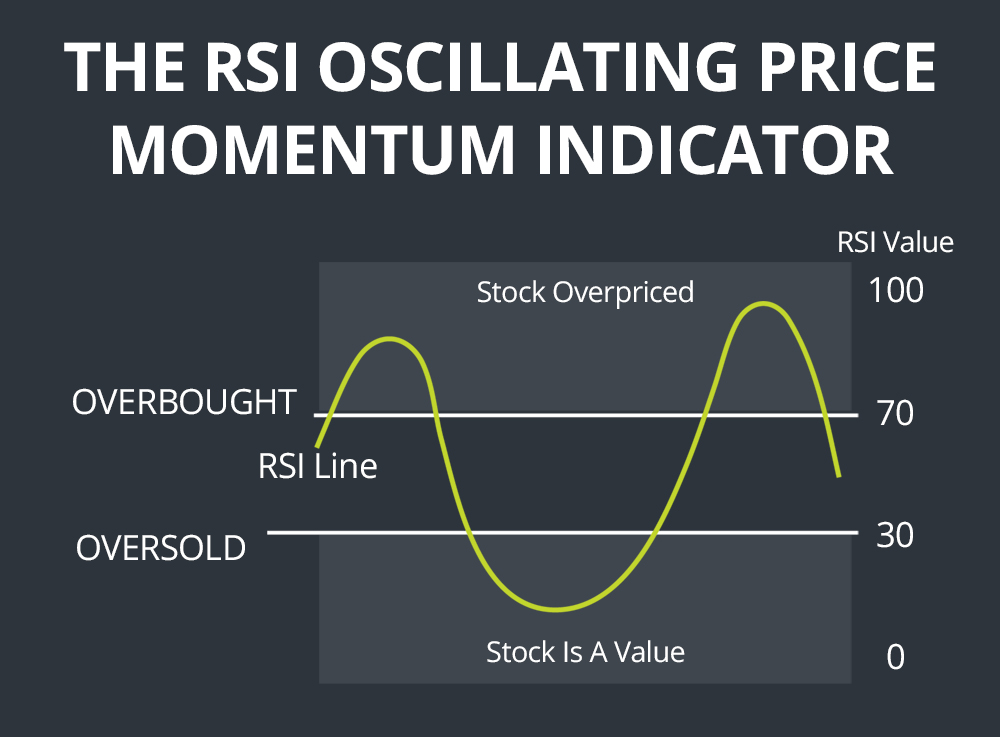
- When the RSI crosses above 70, it indicates the asset is overbought and may be due for a pullback or trend reversal.
- When the RSI crosses below 30, it indicates the asset is oversold and may be due for a rally or trend reversal.
- When using the RSI indicator for intraday trading and day trading, it is possible to combine it with a number of other technical indicators. Momentum indicators are among the most reliable.
- In addition to the above-mentioned levels, traders should also look for divergences, support/resistance levels, and other analysis techniques in order to get a complete picture of market behavior.
When trading on a day or intraday basis, the Relative Strength Index (RSI) is a common indicator to use. You’ve come to the correct spot if you haven’t figured out how to use it yet. What makes this indicator unique, how to calculate it, and its practical applications for traders are discussed in this article.
Some of the methods for RSI trading, such as the RSI Two Period Divergence, and RSI trendlines will also be covered. To further improve your trading, we will assist you in locating other indicators to use in conjunction with the relative strength index (RSI).
Technical analysis & its importance in RSI indicator utilization
First, we’ll cover some groundwork so that we can get into the specifics of how to use the RSI indicator effectively for day trading and intraday trading. Price changes and market patterns may be anticipated with the use of technical analysis, a technique that involves looking at charts of historical market activity and comparing them to the present market.
What has occurred in the market and what may happen in the future are the foci of technical analysis. It considers instrument prices and generates charts based on such information.
Expert technical analysts can keep tabs on many markets and instruments at once, which is a huge time saver. Before delving into the RSI indicator in depth, it’s important to learn the following three foundational concepts in technical analysis:
- Market behavior patterns that have stood the test of time may be identified via technical analysis. There’s a good chance that many common patterns will provide the desired outcomes. In addition, there are regular trends that may be seen and accounted for.
- Patterns in technical analysis charts have been identified and classified for almost a century, and the consistency with which many patterns recur suggests that human psychology has changed little during that period.
- The real price takes into account all of the elements that are known to influence it, such as supply and demand, political considerations, and market mood. Nonetheless, purely technical analysts are focused only on price fluctuations and not their underlying causes.
The Relative Strength Index (RSI) indicator is widely used in technical analysis. The robust RSI formula and the potential application of RSI divergence have contributed to the rise in RSI indicator trading’s popularity.
The relative strength index (RSI) explained
The Relative Strength Index (RSI) is a momentum indicator that compares price increases against decreases and normalises the result to a value between 0 and 100. J.Welles Wilder was the one who came up with the idea. The instrument is considered overbought if the RSI reading is 70 or above (a situation whereby prices have risen more than market expectations).
Undervaluation of the RSI below 30 is seen as an indication that the instrument may be oversold (a situation in which prices have fallen more than the market expectations). Here we learn how to utilise the RSI indicator successfully in day trading.
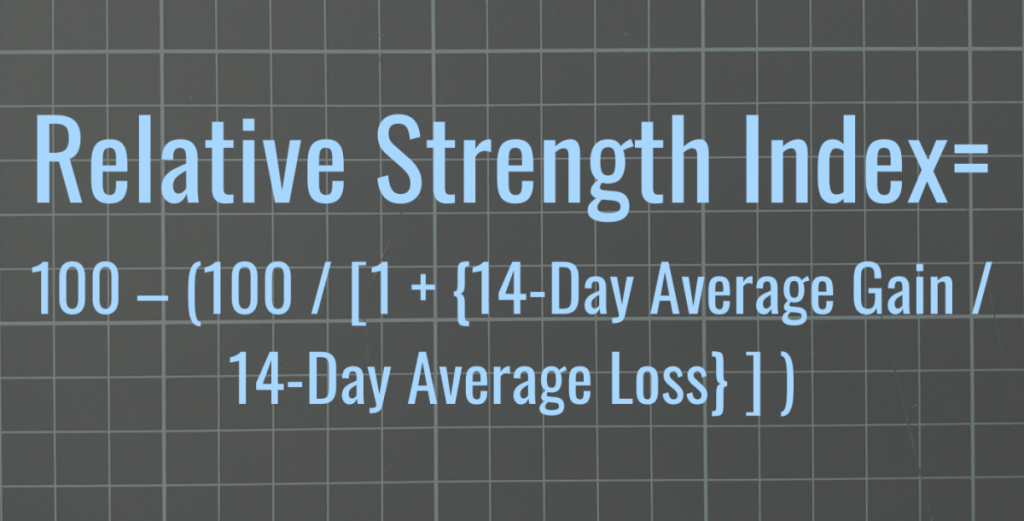
The RSI is a leading indicator. There are two equations needed to solve the RSI formula, which are used to calculate the RSI indicator. The initial Relative Strength (RS) value is calculated by dividing the average number of “Up” closes by the average number of “Down” closes over “N” periods, as shown in the following RSI formula example.
RS = Average (up/down) over N days of closing prices
The following is an example RSI calculation that indexes the indicator to 100 to get its true value.
RSI = 100 – (100 /1 + RS)
Simply drag and drop the indicator onto the main chart window of your MetaTrader (MT4) terminal to connect it to your MT4 chart.
How RSI is calculated
The relative strength index analysis a security’s strength on days when prices move up and down. Traders may gauge a security’s performance by comparing its results to price activity. Using the RSI with other technical indicators may help traders make better judgments.
The RSI formula has two parts.
Average gain or loss is the average percentage gain or loss during a look-back period. Formula employs positive average loss. In calculating average gain, price losses are considered as zero. Price increases are calculated as zero for average loss.
14 periods are utilised to determine the starting RSI. Imagine the market rose 7 out of 14 days, averaging 1%. The subsequent seven days lost -0.8% on average.
The first RSI calculation would be:
With 14 periods of data, the second computation may be done. Its objective is to smooth data so the RSI only nears 100 or zero in a trending market.
RSI Ranges
The most common RSI ranges for trading are 0 – 20 and 80 – 100. These levels signal overbought and oversold conditions in the market respectively. When the RSI is between 30-50, it indicates a neutral trend. When using this indicator, traders should always look for divergence and support/resistance signals to confirm potential trade setups.
How to plot RSI
After calculating RSI, the indicator may be plotted on a price chart. RSI rises with the quantity and magnitude of up days. It will decline with an increase in the size of down days.
The RSI may linger in the overbought range while the stock is rising. In a downturn, the indicator may stay oversold for a while. This may be challenging for inexperienced analysts, but learning to apply the indicator in the context of the current trend can address these concerns.
How to use RSI indicator for day & intraday trading
Now we’ll talk about Day Trading using the RSI indicator. Many traders successfully use the RSI indicator into their day trading approach. Most traders, particularly swing traders, can make do with the RSI’s standard 14-period setting.
However, while utilising the RSI indicator for day trading, some intraday traders uniquely adjust the parameters. The 14 threshold produces too few trading signals, therefore, they avoid employing it. Therefore, some traders prefer to use a shorter time frame, while others choose to reduce the RSI’s length to make it more sensitive.
Some investors get around this issue by trading for shorter periods. Some users want a more responsive oscillator by reducing the RSI’s period setting.
More generally:
Day traders (intraday trades) employ shorter time frames (9-11) and more conservative settings.
Traders that swing for medium periods often choose the preset 14-day timeframe.
Investors that take longer-term positions often choose a duration of 20-30.
The RSI indicator may be used for day trading, however the parameters you choose will depend on your approach.
Determine how much noise you can stand in your trade, and then pick the settings for your trading style. Remember that your ability to recognise trustworthy signals will improve with practice, regardless of the settings you pick.
When you use the RSI indicator for day trading or intraday trading, you focus on making quick, decisive moves. In such a competitive market, traders frequently opt for more conservative settings across the board, which results in early signaling.
Methods for Trading using the RSI Indicator
You have successfully become an expert user of the RSI indicator. However, proper RSI use requires some familiarity with the tool. Now is a good moment to examine every major RSI trading strategy. You may utilise the RSI indicator in a variety of trading methods, and here are some examples of RSI settings:
Relative Strength Index Overbought/Oversold Levels
Since the goal is to initiate a trade just before the price reverses after touching the trendline, we may call this trading strategy an RSI trendline method.
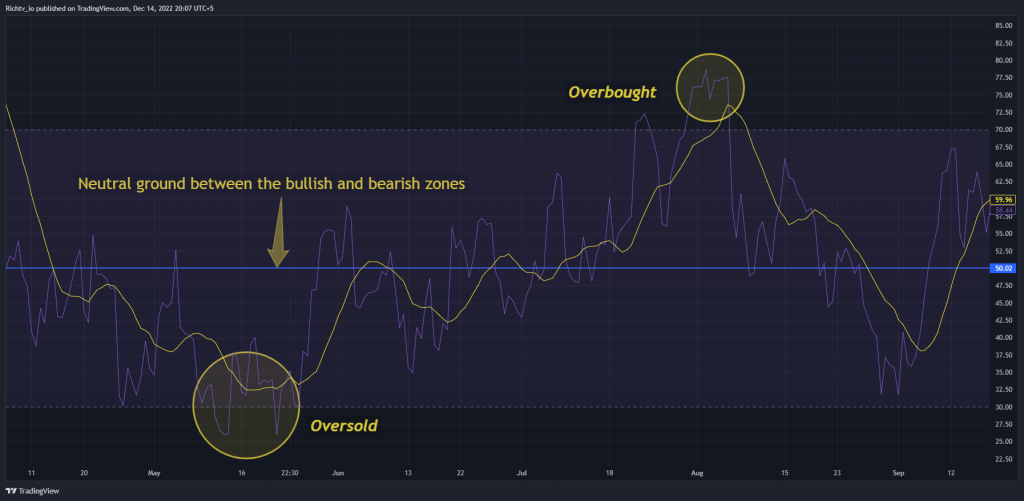
The concept of overbought and oversold is essential when studying RSI. When the RSI indicator crosses 30 on the RSI chart, it’s bullish, while 70 is bearish. In other words, if the RSI is over 70, however, the market is considered overbought, and a price drop is possible. A sell trade may be made after confirmation of the reversal. It’s due for a trend reversal or price decline.
As the RSI drops below 30, the market is considered oversold, suggesting that a price rise is possible. You may conduct a purchase trade when the reversal has been verified. The RSI 50 level represents neutral ground between the bullish and bearish zones extremes. Typically, an upswing will have an RSI over 50, whereas a downtrend would have an RSI below 50.
Security is overbought when its price is above its inherent worth. It’s overpriced, according to technical or fundamental analysts. Traders may predict a price correction or trend reversal if a stock is overbought. They can sell the stock. The same concept applies to an oversold asset identified by technical indications. The pricing is lower than it should be. Traders who see this sign may predict a price correction or trend reversal and buy the asset.
Two-period divergence in the Relative Strength Index
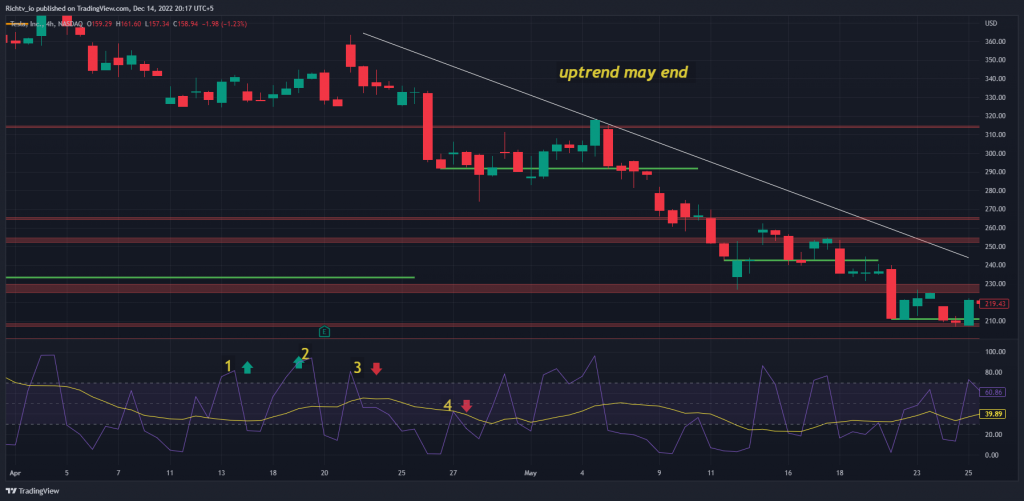
Looking for a two-period divergence is one of the most popular uses of RSI. This occurs when the RSI moves two periods in one direction before changing course for the next two periods.
Traders might interpret RSI two-period divergences as indicating that the trend will change.
For example, if the RSI increases for two periods and then decreases for the next two periods, this could be seen as a sign that the uptrend may be about to end. On the other hand, if the RSI decreases for two periods and then increases for the next two periods, this could signal that a downtrend may have been exhausted and prices start to move higher.
Relative Strength Index Trendlines
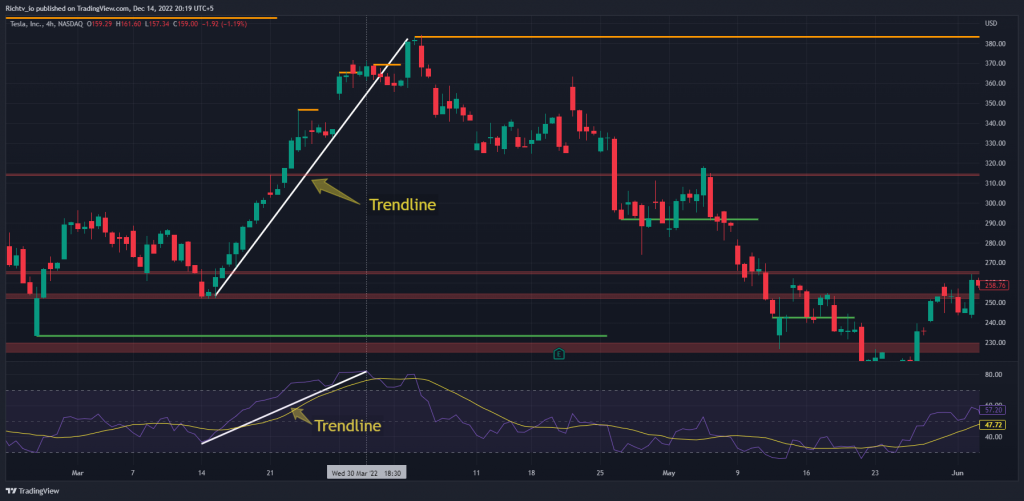
Draw a line from the highest and lowest points on the RSI chart and then watch for a breakout to make a trade. Connecting three or more points on the rising RSI line constitutes an uptrend line.
If the RSI line dips below a certain threshold number of points, we may say that we have established a downward trend. A continuation or reversal in price may follow a breach of an RSI trendline. Keep in mind that the RSI trendline break often occurs before the price chart trendline break, giving you early notice and a window of trading opportunity.
Divergence in the Classic RSI Indicator
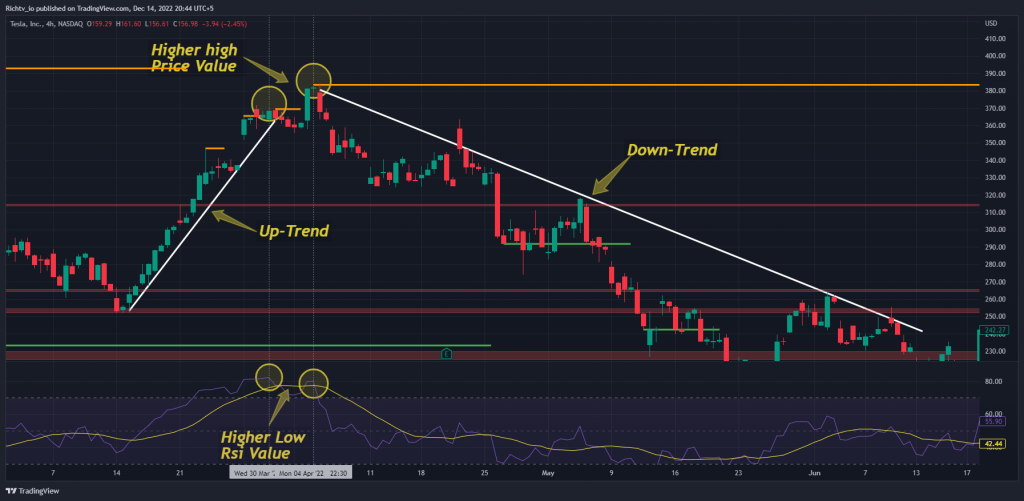
When the price makes a new high and the RSI makes a new low, a bearish divergence is formed. RSI divergence is a reversal pattern that often forms towards the peak of a bull market. When RSI Divergence appears, traders anticipate a reversal. As it occurs in numerous candlesticks before the uptrend reverses direction and breaks below its support line, it is an advanced reversal warning.
In contrast, a bearish RSI divergence will materialize if the price makes a higher high while the RSI makes a lower high. This is indicating that the current upward trend might soon reverse and become a downward trend. In the world of Forex technical analysis, RSI divergence is a common tool. Some investors like trading RSI divergence on longer time periods (H4, Daily). You may use these methods to get several buy and sell indications from the RSI indicator.
What other indicators complement RSI well?
When using the RSI indicator for intraday trading and day trading, it is possible to combine it with a number of other technical indicators, depending on one’s trading strategy and preferences. Momentum indicators are among the most reliable. Two helpful tools are the MACD and the crossover of moving averages.
Overbought RSI readings may persist for lengthy periods of time, and a divergent MACD that turns down as the price rises is another evidence that the market is overextended and may retrace.
Confirming RSI readings using exponential moving averages is a useful technique. As an example, the RSI indicator works well with the EMA 7 crossing over the EMA 21.
The Difference Between RSI and MACD

RSI and MACD are two of the most popular technical indicators used by traders. RSI is an oscillator, which produces values from 0 to 100. It measures how quickly prices have risen or fallen over a given period of time. The MACD is a trend-following indicator that helps identify when prices are accelerating or decelerating.
Risk management should always be a primary concern for traders. When used together, RSI and MACD can help provide a more complete picture of what is happening in the markets and offer additional insights into potential trading opportunities. They are both excellent indicators when it comes to confirming buy and sell signals, finding potential trend reversals, or validating support and resistance.
RSI limitations

The RSI compares bullish and bearish price momentum and presents the findings in an oscillator. Like other technical indicators, it’s most trustworthy when it follows the long-term trend.
True reversal signals are uncommon and hard to detect from fake ones. A bullish crossing followed by a stock drop is a false positive. False negative is when a bearish crossing occurs but the stock immediately rises.
Since the indicator shows momentum, it might remain overbought or oversold when an item has considerable momentum. In an oscillating market (a trading range), when the asset price alternates between bullish and bearish swings, the RSI is most beneficial.
RSI FAQs
How do you use the RSI indicator effectively?
The RSI indicator should be used in conjunction with other indicators and analysis techniques to provide a more comprehensive understanding of the market. It is important to look for divergences, overbought/oversold levels, support/resistance levels, as well as trendlines when using the RSI indicator.
What is overbought and oversold?
Overbought and oversold indicate that the price of an asset is either too high (overbought) or too low (oversold). When the RSI indicator crosses 70 on the RSI chart, it indicates that the asset is overbought and investors should expect a price correction or trend reversal. On the other hand, if the RSI indicator crosses 30 on the RSI chart, it is considered oversold and may provide an opportunity for investors to buy.
What other indicators complement RSI well?
Other technical indicators that can be used to complement the RSI indicator include momentum indicators such as the MACD or crossover of moving averages. Exponential moving averages (EMA) can also be used to confirm RSI readings.
What are some examples of RSI divergences?
A bullish divergence occurs when the price makes a lower low, but the RSI indicator makes a higher low. This indicates that momentum is increasing and a price reversal may be imminent.
On the other hand, a bearish divergence occurs when the price makes a higher high, but the RSI indicator makes a lower high. This indicates that momentum is decreasing and a price correction may be imminent.
By using the RSI indicator for trading, investors can identify when an asset is overbought or oversold, as well as potential reversals in the market. It is important to use other indicators and analysis techniques alongside the RSI indicator in order to get a more comprehensive understanding of the market. Additionally, investors should be aware that false signals and divergences can occur when using the RSI indicator for trading. With these considerations in mind, traders can use the RSI indicator to better inform their investment decisions.
What are some of the limitations of RSI?
The main limitation of RSI is that it may remain overbought or oversold for lengthy periods of time and be less reliable in a market with frequent oscillations. Additionally, true reversal signals can be hard to detect from false ones. Finally, the indicator can give inaccurate results.
What is the most effective time frame for the RSI indicator?
The most effective time frame will depend on your trading strategy and what you are trying to measure. Generally speaking, traders tend to use shorter time frames (5-15 minutes) for intraday or day trading, while longer time frames (daily, weekly) may be used for longer-term trading. It is advisable to experiment with different time frames to find what works best for you.
How do you read an RSI indicator?
The RSI indicator is a momentum oscillator that ranges from 0 to 100, with overbought/oversold levels at 70/30. When the RSI crosses above 70, it indicates the asset is overbought and may be due for a pullback or trend reversal. Conversely, when the RSI crosses below 30, it indicates the asset is oversold and may be due for a rally or trend reversal. In addition to these levels, traders should also look for divergences, support/resistance levels, and other analysis techniques in order to provide a more complete picture of what the market is doing.
Which RSI strategy is best?
The best RSI strategy will depend on what you are trying to achieve and what type of trader you are. Generally speaking, traders tend to use the RSI indicator in conjunction with other indicators for confirmation or as part of a trading system that incorporates multiple analysis techniques. It is important to experiment and find what works best for your particular situation.
Final Words
Because the RSI indicator is so simple to use, many new traders utilise it for day trading or intrading trading without first testing various settings or learning how to correctly read the signal. This has led to the RSI becoming one of the most abused indicators.
When used properly, the RSI indicator may assist day traders determine if prices are moving, when a market is overbought or oversold, and at what point in time to initiate or leave a trade.
In addition to helping you find the best entry and exit points, it can show you which time period has the maximum volume in the market. Technical trend information and RSI buy/sell indications may be obtained from the RSI. Demo trading is the best place to hone your RSI trading methods before moving them to your real money trading account. The RSI methods may also be used in conjunction with any trading approach you presently use.